South Africa
South Africa is committed to a “Peak, Plateau, and Decline” GHG emission reduction plan from the Business As-Usual trajectory, starting in 2020, with emissions peaking between 2020 and 2025 and declining in absolute terms to a range of 398-614 megatons of CO2 equivalent between 2025 and 2030. This commitment applies to all sectors of the South African economy and is expected to have implications for local government policies and actions. You can download South Africa’s latest NDC here.
The Urban-LEDS project Phase I was implemented in South Africa, where a total of eight cities participated. Two Model cities and five Satellite cities participated in the Urban-LEDS process and received support to develop Low Emission Development Strategies, GHG emissions inventories, climate commitments, and implement a variety of low-emission development solutions. Key achievements are outlined below. In Phase II of the Urban-LEDS project, Phase I participating cities will be supported in a review of the progress they have made towards low-emission development, with a focus on developing project proposals and seeking funding to implement the action plans developed in Phase I. Where needed, data will be updated, including greenhouse gas inventories and climate change vulnerability risk assessments.
Led by: ICLEI Africa Secretariat
About South Africa
The South African Project Advisory Group was formed during a meeting in September 2013, and launched again for phase II at the Urban-LEDS ll Summit in Johannesburg in May 2018. It includes representatives of United Nations Environment, the National Department of Environmental Affairs (DEA), the Department of Cooperative Governance and Traditional Affairs (COGTA), South Africa Local Government Association (SALGA), and the Energy Research Centre at the University of Cape Town. The UN-Habitat and European Commission representatives in South Africa, the Department of Energy (DoE), the National Treasury, SANEDI/REEEP, SACN, the City of Cape Town, eThekwini Municipality, Sustainable Energy Africa (SEA), the Energy Research Centre, the National Business Institute (NBI), the Development Bank of South Africa (DBSA), GIZ, and rotating municipal representatives from the Urban-LEDS cities, were also involved in phase I PAG.
Contact us
ICLEI Africa Secretariat
3 Knowledge Park, Century City, Cape Town
Tel: +27212020381
Fax: +27 87 809 6185
E-mail: [email protected]
Results from Phase I
The national project launch took place in February 2013 in Ekurhuleni, South Africa at an event where over 45 representatives from national, provincial, local government, research organizations, NGOs, and the private sector took part.
As Urban-LEDS Phase I finished, South African cities had achieved the following:
- KwaDukuza: In January 2016, KwaDukuza’s Council adopted the Low Emissions Development Strategy and Action Plan and incorporated key elements into its Integrated Development Plan (IDP). The IDP is a mandated plan by national government, and embedding a low emission approach here is a unique way of delivering the Urban LEDS.
- Steve Tshwete: In February 2016, the Low emission Position Statement was included in Steve Tshwete’s Integrated Development Plan and submitted to the Municipal Council for approval. Meanwhile, demonstration projects in the community, political will, and awareness raising activities have set a process of chance in motion.
- All but one South African city have started reporting in the carbonn® Climate Registry (cCR). You can visit these registries in the city profiles below.
- Demonstration projects have been implemented across the South African Urban-LEDS cities on a range of low-emission development solutions, including energy efficient lighting, low carbon waste management, green buildings, awareness raising, etc. To read more about these solutions, download the final Urban-LEDS report or view the cities’ Urban-LEDS or cCR registries in the city profile tabs below.
- The project’s 1st International Networking Seminar was hosted by Nelson Mandela Bay Municipality in 2013.
Model cities
KwaDukuza
Steve Tshwete
Satellite cities
Mogale City
Nelson Mandela Bay
Overberg District Municipality
Saldanha Bay
Sol Plaatje
uMhlathuze
See tabs below for city profiles.
The KwaDukuza Local Municipality is located within the iLembe District in the KwaZulu-Natal Province. It is one of the four municipalities that make up the district, stretching from the Zinkwazi River in the north to the Tongaat River in the south. KwaDukuza (previously Stanger) is the district node and dominant commercial center in the iLembe District. The name KwaDukuza epitomizes the historical background of the area being the home to King Shaka Gravesite and Memorial. The town KwaDukuza is built on the original site of King Shaka’s Royal settlement called Dukuza. The KwaDukuza museum is situated opposite the site of King Shaka Memorial and is dedicated to the sugar industry, the cultural heritage of the early settlers of the town Stanger.
The KwaDukuza Municipality occupies a coastal and inland stretch of approximately 50km in length and 14km in width, with a variety of clustered and ad hoc settlements and small towns. KwaDukuza functions as the district node and dominant commercial center in the ILembe District. The key feature of KwaDukuza is the N2 Development Corridor that runs through it. Historically, the land of the KwaDukuza municipality would to a large degree have been covered by a mosaic of large areas of coastal belt grassland, interrupted by forest patches (particularly on the south facing slopes), wetlands, and riverine vegetation. Currently, the land cover of the municipality is overwhelmingly dominated by the cultivation of sugar cane. KwaDukuza has a subtropical climate with summer rains.
| Size of population (year) | 276,719 (2016) |
| Size (km²) | 734.96 km² |
| Population density (year) | 4.56 hab/km² (2011) |
| Official language(s) | IsiZulu, English and IsiXhosa |
| Major economic activities in the city | Primary sector: Agriculture is the dominant economic sector in KwaDukuza contributing 23% of the total gross domestic product. The dominant agricultural product is sugar cane. There are however also other agricultural products such as vegetables, flower, and sub-tropical vegetables. The majority of the commercial farming areas consist of large-scale activities. The municipality also accommodates areas of afforestation and related paper mills at Mandeni an KwaDukuza.
Secondary sector: industry, manufacturing, industrial manufacturing investments in KwaDukuza include the Stanger Sappi Paper Mill and Sugar Mills in Darnall and Gledhow. The Isithebe Industrial Estate in the Mandeni area is of significance in the north and the UThongathi/ Maidstone industrial areas in eThekwini in the south. Smaller scale light industrial activities exist north of Ballito and in the Groutville area. Tertiary Sector: the primary factors that attract tourists to this province are its beaches, visits to family and friends, the wildlife, and Zulu culture. The KwaDukuza area is very rich in Indian heritage and this can be felt in the Stanger area particularly as well as Shakaskraal. The KwaDukuza area also has a rich heritage in the form for the Zulu culture. It has a diversity of rich colours and cultures. The North Coast (Dolphin Coast) Ballito, Salt Rock, Dolphins, Shaka and Zimbali are some of the terms associated with this up-market “beach tourism Mecca” of the Zulu Kingdom of KwaZulu-Natal. Some of the tourist sites in KwaDukuza are Tinley Manor Lagoon, King Shaka’s Memorial Monument, and the Chief Albert Luthuli Museum (KwaDukuza IDP 2017). |
| Population growth trend | 11% (2008-2011) |
| % of population living in urban areas | 86.8% |
| Average annual rate of urbanisation | 4.09% per annum (2016) |
| Greenhouse Gas emissions (total in C02e/year) | 1,008,657 t CO2e (KwaDukuza Municipality 2012) |
| City official website | Click here |
| carbonn Climate Registry (cCR) profile | Click here |
Greenhouse Gas emissions by sector
- Agriculture
- Residential Buildings
- Commercial / Industrial Facilities
- Industrial Energy Use
- Transport
- Waste
- Transmission & Distribution
| Source | Amount (tCO2e) | % |
|---|---|---|
| Agriculture | 11,687 | 1.15% |
| Residential Buildings | 232,544 | 23.05% |
| Commercial / Institutional Facilities | 255,395 | 25.32% |
| Industrial Energy Use | 278,697 | 27.63% |
| Transport | 220,652 | 21.90% |
| Waste | 9,675 | 0.2% |
| Transmission & Distribution | 25,545 | 2.5% |
The Steve Tshwete Local Municipality (previously Middelburg Local Municipality) is located in the Nkangala District of the Mpumalanga Province. It is one of the larger municipalities of the six in the district and is the host of the District Municipality (i.e. the seat). The municipality is named after Steve Tshwete, an ANC activist imprisoned by the apartheid authorities on Robben Island from February 1964 to 1983. Steve Tshwete, the urban core, was established in 1864 by the Voortrekkers, who named the town Nasareth. It later became known as Middelburg (middle town) because of its location halfway between Pretoria, then capital of the Transvaal, and Lydenburg. The seat of the Steve Tshwete Local Municipality is Middelburg. The municipality is strategically located with easy access to Mozambique, Swaziland, and Gauteng province.
This Local Municipality is situated 1,492 meters above sea-level on the main road to the Mpumalanga Lowveld and the Kruger National Park. There are strong coal, copper, and platinum (Sheba’s Ridge) mining activities in the area supported by the large mining companies as well as independent operators. There is a variety of agricultural activities ranging from maize and cattle farming, and three of Eskom’s powers generating plants are within the municipal boundaries: Arnot Power Station; Hendrina Power Stations, with Komati Power Station being recommissioned (Steve Tshwete local economy).
| Size of population (year) | 278,749 (2016) |
| Size (km²) | 3,984.1 km² |
| Population density (year) | 70.0 hab/km² (2016) |
| Official language(s) | IsiZulu, IsiNdebele, Afrikaans |
| Major economic activities in the city | This local economy is one of the largest economies in the district context and is similar to the Emalahleni economy, dominated by the mining and manufacturing sector. The local economy is also characterized by the location of various Eskom power stations and mines in the area. |
| Population growth trend | 9.7% |
| % of population living in urban areas | 73% (2017) |
| Average annual rate of urbanisation | 72.1% (from 1996 to 2008) |
| Greenhouse Gas emissions (total in C02e/year) | 7.1 million tCO2e (2012) |
| City official website | Click here |
| carbonn Climate Registry (cCR) profile | Click here |
Greenhouse Gas emissions by sector
- Agriculture
- Residential Buildings
- Commercial / Institutional facilities
- Industrial Energy Use
- Transport
- Waste
- IPPU
| Source | Amount (tCO2e) | % |
|---|---|---|
| Agriculture | 57,888 | 0.8% |
| Residential Buildings | 454,385 | 6.3% |
| Commercial / Institutional Facilities | 271,046 | 3.8% |
| Industrial Energy Use | 5,119,384 | 73.07% |
| Transport | 647,799 | 9.1% |
| Waste | 45,349 | 0.6% |
| IPPU | 438,941 | 0.6% |
Mogale City is situated at the western side of the Gauteng Province. It also forms part of the broader West Rand District Municipality. The towns in Mogale City municipality include Magaliesberg, Krugersdorp, Muldersdrift, Kagiso, Hekpoort, and Maanhaarand. Mogale City, previously known as the Krugersdorp Local Council, is named after Chief Mogale-Wa-Mogale, the young heir to the Ba-Po Chiefdom of the Batswana. Mogale City’s strongest functional urban linkage is with the City of Johannesburg. Krugersdorp has been the center of the establishment of Mogale City. Krugersdorp was founded in 1887 by Marthinus Pretorius and named after Paul Kruger. Krugersdorp was founded as a mining town of gold, asbestos, and magnesium among others during the 1880s. Kagiso and Krugersdorp are primary urban complex that form part of Corridor of Freedom in Gauteng, namely, the Western Corridor (Mogale City IDP 2017-2018).
Mogale city is accessible from all the major centers of Gauteng and North West Province, namely Johannesburg, Pretoria, Midrand, Hartebeespoort Dam, Randfontein, and Soweto. The strongest east-west transport linkages between Mogale City and City of Johannesburg are along the R512 as well as the railway line. Mogale City is the birthplace of humankind, the City of Human Origin. It is privileged to be the home of the 2.2-million-year old skull of Mrs. Ples, found at the Sterkfontein Caves in the Cradle of Humankind – a UNESCO World Heritage Site. Chief Mogale–Wa–Mogale is recognized as one of the first South African freedom fighters. Generations have been inspired by his bravery and tireless attempts at restoring ancestral land to his people. The largest part of MCLM is rural in nature with an environment characterized by intensive as well as extensive agricultural development, agricultural holdings, physical elements such as mountains and rivers, wilderness areas, and nature conservation areas. The largest urban concentration in MCLM is found in the south-eastern parts around Krugersdorp and Kagiso. The climate in Mogale City is warm and temperate. The summers here have a good deal of rainfall, while the winters have very little. MCLM has ridge and mountain features in the northwest and more undulating topography towards the eastern parts. The topography of MCLM ranges from 1220 m above sea level in the east (northeast of the Magalies plain) to 1840 m above sea level at the Magaliesberg in the north-west (Mogale city Climate Change framework 2014).
| Size of population (year) | 383,864 (2016) |
| Size (km²) | 1,342 km² |
| Population density (year) | 286 hab/km² (2016) |
| Official language(s) | IsiZulu, Afrikaans, English |
| Major economic activities in the city | Primary sector: agriculture, forestry, fishing, mining, and quarrying contribute 4.7%. Mining in Mogale City is a prominent spatial feature in the form of the east-west mining belt which extends from Johannesburg through to Krugersdorp along the so-called “Main Reef”. Although the principle mining activities in Mogale City have closed down (with the exception of the reworking of a number of mine dumps).
Secondary sector: manufacturing, electricity, gas, water, and construction. The total contribution is 30% wholesale and retail trade; personal and household goods; sale, maintenance, and repair of motor vehicles; hotels and restaurants, and other provision of short-stay accommodation. Tertiary Sector: includes wholesale and retail trade, transport and communication, finance and business services, government and social services, collectively contributing 65.3%. Large infrastructure projects like the planned logistics hub in Chamdor as well as strategic projects like the Rustenburg-Mogale City Corridor development are also contributing sectors ( Mogale city IDP, West Rand District IDP 2014-2015). |
| Population growth trend | 2,04% (2011) |
| % of population living in urban areas | 94,2% |
| Average annual rate of urbanisation | 1,58% |
| Greenhouse Gas emissions (total in C02e/year) | – |
| City official website | Click here |
| carbonn Climate Registry (cCR) profile | Click here |
Nelson Mandela Bay is one of eight metropolitan municipalities in South Africa. Situated on the shores of the Indian Ocean, overlooking Algoa Bay in the Eastern Cape Province. The name “Nelson Mandela Bay Municipality” was chosen to honor former President Nelson Mandela. The main cities/towns in the Nelson Mandela Bay Metropolitan Municipality are: Bethelsdorp, Bloemendal, Blue Horizon Bay, Clarendon Marine, Despatch, KwaNobuhle, Motherwell, Port Elizabeth, and Uitenhage. Nelson Mandela Bay is known for its historical legacies, the landing place of the 1820 Settlers is seen through some of the finest Victorian and Edwardian architecture in the city. It is also known for the water sporting activities, tourism, and the hub of the automotive industry on the African continent. The Nelson Mandela bay municipality is home to South Africa’s first industrial development zone (IDZ) Coega. The port of Port Elizabeth and the Coega Deep Water Harbor are strategic growth points with facilities for the handling of all commodities – bulk, general, and container cargo. Being the center of the country’s motor vehicle manufacturing industry, the port imports large volumes of containerized components and raw materials for this industry.
Nelson Mandela Bay has a temperate climate with summer and winter temperatures averaging at 25°C and 17°C respectively, and with annual rainfall ranging from 500 to 650 mm, the majority of which falls between May and October. The winds in this area are predominantly from the southwest during the winter, northwest during autumn, and easterly during the summer and spring. The coastal region of Nelson Mandela Bay, boasts 40 km of magnificent golden beaches. With its perfect combination of warm water, calm sea, and fair breezes, it is one of the best sailing venues in the world for water sport enthusiasts. It is also home to the Addo Elephant National Park, a diverse wildlife conservation park situated close to Port Elizabeth (Nelson Mandela Bay Municipality Bioregional Plan 2014).
| Size of population (year) | 1,263,051 (2016) |
| Size (km²) | 19,58.91 km² |
| Population density (year) | 646 hab/km² (2016) |
| Official language(s) | Top three languages: IsiXhosa, Afrikaans, English |
| Major economic activities in the city | Primary sector: mining and the agricultural. Between 2006 and 2016, the agriculture sector experienced the highest positive growth in 2006 with an average growth rate of 14.6%. The mining sector reached its highest point of growth of 16.4% in 2012. The agricultural sector experienced the lowest growth for the period during 2016 at -9.1%, while the mining sector also had the lowest growth rate in 2016 and it experiences a negative growth rate of -13.2% which is higher growth rate than that of the agricultural sector.
Secondary sector: manufacturing, electricity, and the construction sector contributes 24,6% Gross Value Added within the Nelson Mandela Bay Metropolitan Municipality. Between 2006 and 2016, the manufacturing sector experienced the highest positive growth in 2007 with a growth rate of 6.6%. It is evident for the construction sector that the highest positive growth rate also existed in 2007 and it experienced a growth rate of 13.7% which is higher than that of the manufacturing sector. The manufacturing sector experienced its lowest growth in 2016 of -7.7%, while construction sector reached its lowest point of growth in 2016 a with -0.2% growth rate. Tertiary sector: The tertiary sector contributes the most to the Gross Value Added within the Nelson Mandela Bay Metropolitan Municipality at 79,6%. The tertiary sector consists of four broad economic sectors namely the trade, transport, finance and the community services sector. The trade sector experienced the highest positive growth in 2007 with a growth rate of 7.5%. It is evident for the transport sector that the highest positive growth rate also existed in 2007 at 7.6% which is higher than that of the manufacturing sector. The finance sector experienced the highest growth rate in 2007 when it grew by 6.6% and recorded the lowest growth rate in 2009 at -1.7%. The Trade sector had the lowest growth rate in 2008 at -5.6%. The community services sector, which largely consists of government, experienced its highest positive growth in 2007 with 6.3% and the lowest growth rate in 2016 with 0.8%. ( Nelson Mandela Bay Municipality socio-economic review and outlook 2017) |
| Population growth trend | 1.8% |
| % of population living in urban areas | 97.7 % |
| Average annual rate of urbanisation | 1.53% |
| Greenhouse Gas emissions (total in C02e/year) | 5.2 million tCO2e (2012) |
| City official website | Click here |
| carbonn Climate Registry (cCR) profile | Click here |
Saldanha Bay Municipality is situated, in the Western Cape Province on the west coast of South Africa, approximately 100 km north of Cape Town. Saldanha Bay Municipality was named after the Portuguese admiral Antonio de Saldanha who anchored his fleet to Table Bay in 1503. The bay was essential during WWII due to its strategic location and secure anchorage as convoy assembly point. The Bay area in Saldanha plays an important role in the broader strategic framework of the South African Government as driven by the National Development Plan and National Growth Plan. The National Development Plan 2012 (NDP) identifies the Greater Saldanha region as a special intervention area, attributed to the natural deep water harbor and industrial development prospects that warrant its designation as a national growth management zone. The Saldanha Bay Industrial Development Zone (IDZ) was officially launched in 2013, serving as an important mechanism to achieve the government’s aim of sustainable economic development and job creation in the localized economy, diversification and transformation of the historically under-developed and under-supported industrial maritime and energy sectors, and broadening of the regional and national economic base through industrialization.
The Saldanha Bay Municipality covers a coastal line of 238 km bordered in the west by the Atlantic Ocean. Overall Saldanha Bay municipality constitutes 6.4% of the entire West Coast geographical land making it the smallest municipal area in the district. The area includes conservation areas of international importance such as the Langebaan Lagoon, the west coast fossil park, and Verloren Vlei ( ACDI website). The West Coast National Park, which contains mostly strandveld vegetation (24,025 ha), and Cape Columbine Nature Reserve are well-known for West Coast fynbos to Karoo succulents. During spring, from August to September, the area is covered in a bright tapestry of wild flowers. There are there are 7 small islands in the Langebaan Lagoon namely; Vondeling Island, Jutten Island, Meeuw Island, Schaapen Island, Marcus Island, Malgas Island, and Klein Island. Saldanha Bay is the deepest natural bay in the southern hemisphere, which makes it a strategic national economic growth point for the export of raw and processed minerals and metals.
The Port is situated on the northern shore of Saldanha Bay. The surrounding topography is defined by a gently undulating coastal plain with low hills. The Saldanha Bay climate is characterized as semi-arid Mediterranean which is strongly influenced by the cold Benguela Current and coastal berg wind conditions. The dry summer months occur from October to April while the majority of precipitation occurs during the winter months in May to September.
| Size of population (year) | 111,173 (2016) |
| Size (km²) | 2015 km² |
| Population density (year) | 55,2 hab/km² (2016) |
| Official language(s) | Afrikaans, English and IsXhosa, |
| Major economic activities in the city | The primary sector contributes 15.4 % and secondary sector 29.1%, tertiary sector 55.5% to the Saldnha bay GDPR performance per sector 2005- 2016. The Primary sector consists of agriculture, mining, fishing, and employed 31.77% of the workforce in the municipality. Secondary sector: industry and manufacturing are the second largest sector in the Saldanha Bay region. A large number of workers employed in the manufacturing sector are classified as semi-skilled (39.6%) and low-skilled (31.8%). The construction sector employed only 4.96% of the area’s workforce in 2015. The Tertiary: services – Commercial services encompass the wholesale and retail trade; catering and accommodation; transport; storage & communication; and finance, insurance, real estate, and business services industries is the largest sector in the region (Saldanha bay Municipality 2017 -2022 IDP). |
| Population growth trend | 2.59% |
| % of population living in urban areas | 96.8% |
| Average annual rate of urbanisation | 1.8% |
| Greenhouse Gas emissions (total in C02e/year) | 433,932 tCO2e/2012 (Energy Consumption And Co2e Emissions Database For The Western Cape 2012: 80) |
| City official website | Click here |
| carbonn Climate Registry (cCR) profile | – |
Greenhouse Gas emissions by sector
- Commercial
- Municipal Operations
- Industrial
- Residential
- Transport
- Solid Waste
| Source | Amount (tCO2e) | % |
|---|---|---|
| Commercial | 100,705 | 23.2% |
| Municipal Operations | 37,114 | 8.5% |
| Industrial | 27,989 | 6.4% |
| Residential | 95,770 | 22% |
| Transport | 161,475 | 37.2% |
| Solid waste | 10,878 | 2.5% |
In the post-apartheid era the Kimberley City Council was renamed the Sol Plaatje Local Municipality. The Municipality is named after Solomon Tshekisho Plaatje who was a South African intellectual, journalist, linguist, politician, translator, and writer. The Sol Plaatje municipality is the seat of the Northern Cape Provincial Government and the Frances Baard District Council. The municipality houses 20% of the population of the province. Sol Plaatje Municipality, includes the town of Kimberly and Ritchie. Kimberley is the seat of the Northern Cape Division of the High Court of South Africa, which exercises jurisdiction over the province. Kimberly also has considerable historical significance due to its diamond mining past and the siege during the Second Boer War (Sol Plaatje Municipality: Integrated Development Plan – IDP (2017 – 2022)).
Kimberley is approximately 110 km east of the confluence of the Vaal and Orange Rivers. It is the only secondary city in the Northern Cape. The discovery of diamond deposits in 1871, on a hillock labelled Colesburg Kopje on the farm Vooruitzicht, led to mining diggings and urban formations. Vast diamond deposits found in the Kimberley mine, now known as the ‘Big Hole’, led to a scramble for fortunes and stimulated development. The roots of the De Beers Company, the leading diamond company in the world, can also be traced to the early days of the mining town. Kimberley was the first city in the Southern Hemisphere and the second in the world after Philadelphia to integrate electric street lights into its infrastructure. The first Stock Exchange in Africa was also built in Kimberley, as early as 1881 (Sol Plaatje Municipality: Integrated Development Plan – IDP (2017 – 2022)).
The topography of Kimberley is generally flat with sparse vegetation due to the hot and dry climate. Temperatures can reach to 40°C in the summer and 0°C in the winter. One of Kimberley’s famous features is Kamfers Dam, a large pan north of the city, which is an important wetland supporting a breeding colony of lesser flamingos (https://www.sa-venues.com/game-reserves/nc_kamfers-dam.htm).
| Size of population (year) | 255,040 (2016) |
| Size (km²) | 3,145 km² |
| Population density (year) | 81 hab/km² (2016) |
| Official language(s) | Top Three Languages: Afrikaans, SeTswana, English (Stats SA Community survey 2016) |
| Major economic activities in the city | The primary sector which consists of the agriculture sector contributes 1% and mining sector 8% to the Sol Plaatje economy. The secondary sector which includes the Manufacturing sector contributes 3% and the Tertiary sector consisting of Community services contributes 28%, finance sector contributes 19%, transport sector contributes 19% and trade contributes 15% to the local economy.
The economy of Sol Plaatje municipality is skewed to tertiary sector and minimal contribution is received from primary and secondary sector. The agriculture sector accounts for 7% of the Northern Cape provincial economy, and the mining sector’s share in the provincial economy is 22%, this accounts for 6% of all mining in South Africa (Sol Plaatje 2018/2019 IDP). |
| Population growth trend | 2,04% (2001-2011) |
| % of population living in urban areas | 98.17% |
| Average annual rate of urbanisation | – |
| Greenhouse Gas emissions (total in C02e/year) | 863,083 tCO2e (2005) |
| City official website | Click here |
| carbonn Climate Registry (cCR) profile | Click here |
Greenhouse Gas emissions by sector
- Commerce and industry
- Transport
- Households
- Local authority
| Source | Amount (tCO2e) | % |
|---|---|---|
| Commerce and industry | 388 387,35 tCO2e | 45% |
| Transport | 241 663,24 tCO2e | 28% |
| Households | 215 770,75 tCO2e | 25% |
| Local authority | 17 261,66 tCO2e | 2% |
The City of uMhlathuze is situated on the northeast coast of the province of KwaZulu-Natal, about 180 km northeast of Durban. The City of uMhlathuze comprises of the central business districts of Richards Bay, eMpangeni, Heatonville, and Buchanana in Ntambanana. The City of uMhlathuze is also home to the deepest Harbor in the continent and vast land for heavy duty industries. The Richards Bay Industrial Development Zone (RBIDZ) is set aside for foreign direct investments and is important for the national economy.
The municipality borders a coastline that spans approximately 45 km. The N2 highway traverses the City of uMhlathuze in northeast direction towards Mpumalanga Province, Swaziland, and Mozambique and southwest towards Durban, Pietermaritzburg, Eastern Cape, and Gauteng Province. The linkages through rail and road network makes the City of uMhlathuze and its harbor makes it easily accessible for commercial purposes especially imports and exports. The area is inundated with an ecosystem of wetlands and natural water features such as Lakes Cubhu, Mzingazi, Nsezi and Nhlabane. Major rivers include the uMhlathuze River which the City is named after, and the Nsezi River. The Climate conditions are typically sub-tropical to tropical. The average daily temperature in summer is 28°C and in winter 24°C in Empangeni, and 22°C in Richards Bay. The humidity levels tend to be very high and the annual rainfall is 1100 mm in Empangeni, and 1200mm in Richards Bay.
| Size of population (year) | 410,465 (2016) |
| Size (km²) | 1,195 km² |
| Population density (year) | 332.3 hab/km² |
| Official language(s) | IsiZulu, English, Afrikaans |
| Major economic activities in the city | Primary sector: agriculture, forestry and fishing, mining, and quarrying contributed 8% to the GVA of the municipality.
Secondary sector: manufacturing, electricity, gas, water and construction. Its contribution to the local Municipality’s GVA is 32% and 41 % to the Provincial economy. Tertiary Sector: tertiary services include trade, transport and communication, finance and business services, general government and personal services. Its contribution to the municipality’s GVA is 60% and 68% to the KwaZulu natal economy. Tourism has made some important contribution to the overall economy, although not significant enough. Rising from 5% in 2001 to 8% in 2003, the GDP contribution has remained somewhat stagnant, averaging 8% from 2003 to 2012 (City pf uMhlathuze IDP; urban Econ 2017). |
| Population growth trend | 22,73 %(2011-2016) |
| % of population living in urban areas | 39% |
| Average annual rate of urbanisation | 1,5% (2016) |
| Greenhouse Gas emissions (total in C02e/year) | 11 721 558 tCO2e (2017) |
| City official website | Click here |
| carbonn Climate Registry (cCR) profile | Click here |
Greenhouse Gas emissions by sector
- Residential
- Commercial and Institutional
- Agriculture
- Transport
- Non-specified distribution losses
- Manufacturing and Construction
| Source | Amount (tCO2e) | % |
|---|---|---|
| Residential | 184 896 tCO2e | 1.5% |
| Commercial and Institutional | 116 723 tCO2e | 1% |
| Agriculture | 151 532 tCO2e | 1.3% |
| Transport | 350 589 tCO2e | 3% |
| Non- specified distribution losses | 37 181 tCO2e | 0.4% |
| Manufacturing & Construction | 10 880 637 tCO2e | 92.8% |
The Overberg District Municipality is situated in the Western Cape Province. The municipality is the smallest district in the province, making up 9% of its geographical area. The following local municipalities form part of the Overberg region: Theewaterskloof, Overstrand, Cape Agulhas, and Swellendam. The municipal headquarters are located at Bredasdorp in the southern part of the district. Grabouw is the Overberg’s economic hub, and lies in the center of the Elgin valley in Overberg. The history of the Elgin/Grabouw region has been predominantly influenced by agriculture, in particular deciduous fruit farming. Tourism is also a growing influence in the general Overberg region, and Elgin is now synonymous with mountain biking and other outdoor activities. Other attractions in the area include hiking in the nature reserves that surround the town, as well as the numerous farm stalls, restaurants, and wine farms in the area.
The Overberg District lies to the southeast of Cape Town. It stretches from the Hottentots-Holland Mountains in the west, to the Breede River mouth in the east, and as far as the Riviersonderend Mountains in the north. It includes Cape Agulhas, the southern-most point in Africa, and has coastlines on both the Atlantic and Indian oceans. The valley was also home to early inhabitants of the Western Cape, evident in the name of the surrounding mountains, Hottentots Holland – “Hottentots” being the name given to the Khoikhoi people who lived in the area before the arrival of European settlers. Grabouw/Elgin is situated close to the Kogelberg Biosphere reserve, a UNESCO site, which displays many examples of unique species of mountain fynbos, endemic to South Africa (Coastal Management (Set-back) Lines for the Overberg District 2015). The Overberg municipality normally receives most of its rainfall during winter and has a Mediterranean climate.
| Size of population (year) | 286,786 (2016) |
| Size (km²) | 12,240.78 km² |
| Population density (year) | 21.09 hab/km² (2011) |
| Official language(s) | Afrikaans, IsiXhosa, English |
| Major economic activities in the city | Primary sector: agriculture, mining, fishing – comprised R1.49 billion (or 11.2%) of the Districts’ GDP in 2015. Employed roughly 24 217, or 19.3% and the majority (58.0%) of the workforce in agriculture, forestry and fishing operate within the low-skill sector.
Secondary sector: manufacturing, construction -manufacturing sector comprised R1.73 billion (or 13.0%) of the District’s GDP in 2015. Employed 9,072 workers (or 7.2% of the District’s workforce) in 2015 and the majority of the workers employed in the manufacturing sector are classified as semi-skilled (45.7%) and low-skilled (26.2%). The construction sector comprised R774.4 million (or 5.8%) of the District’s GDP in 2015, making it among the smallest sectors in the region. The construction industry employed 11,086 workers (or 8.8% of the District’s workforce) in 2015. The majority (54.2%) of the workers employed in the construction industry operate within the informal sector. Tertiary Sector: commercial services – encompassing the wholesale & retail trade, catering & accommodation, transport, storage & communication and finance, insurance, real estate & business services industries. Commercial services comprised R7.05 billion (or 52.9%) of the District’s GDP in 2015 (the largest sector in the region). This sector employed the majority (43.2%) of the District’s workforce. More than a third (39.0%) of the industry’s workforce operates within the informal sector. Semi-skilled employment (the industry’s 2nd largest employer) makes up 33.6% of the commercial services industry, skilled employment makes up only 12.0% of the industry’s workforce (Western Cape socio-economic profiles 2016) |
| Population growth trend | 7.2% growth of the 2017 base estimate |
| % of population living in urban areas | 87,5% |
| Average annual rate of urbanisation | 0,96% |
| Greenhouse Gas emissions (total in C02e/year) | 1,144,261 tCO2e (2012) |
| City official website | Click here |
| carbonn Climate Registry (cCR) profile | Not available yet |
Greenhouse Gas emissions by sector
- Agriculture
- Commercial
- Municipal Operations
- Eskom Streetlighting
- Industrial
- Residential
- Transportation
- Solid Waste
| Source | Amount (tCO2e) | % |
|---|---|---|
| Agriculture | 153,613 | 13.42% |
| Commercial | 237,727 | 20.77% |
| Municipal Operations | 94,300 | 8.2% |
| Eskom Streetlighting | 1,148 | 0.1% |
| Industrial | 127,376 | 11.1% |
| Residential | 222,340 | 19.4% |
| Transportation | 255,216 | 22.3% |
| Solid Waste | 52,541 | 4.5% |
News from the country
Small cities and towns struggle to finance climate action, but better data can help
In South Africa, smaller municipalities are finding ways to fill the climate data gap prevalent across Africa and it is taking them a crucial step closer […]
Urban-LEDS ll cities in Africa show their commitment to climate action in 2020 through virtual engagements
Faced with the logistical constraints which the COVID-19 crisis has brought about in 2020, but acknowledging that the need to build back stronger and more sustainably […]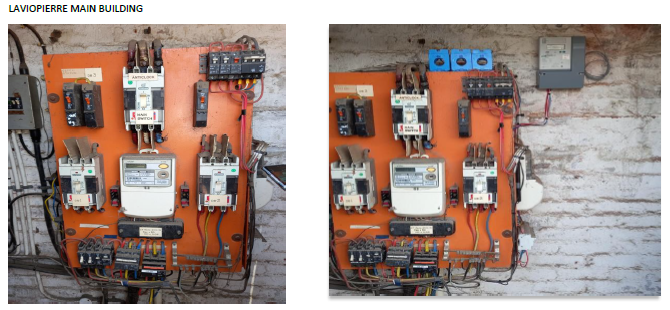
Implementation of building and street lighting energy metering in 7 South African Urban-LEDS cities
7 Urban- LEDS cities in SA demonstrating the value of energy metering in municipal buildings and street light areas for low emissions development Through the work […]
KwaDukuza triumphs as the national WWF One Planet City Challenge winner
KwaDukuza (formerly known as Stanger), a local municipality in northern KwaZulu-Natal, was selected as the winner, beating seven other entries, four of which were major cities. […]