Rwanda
Rwanda’s NDC catalogues a number of activities to be implemented that will yield quantifiable reductions in GHG emissions, and suggests that an overall target for GHG emissions reduction will be forthcoming. Rwanda’s Urbanization and Rural Settlement Sector Strategic Plan (2013 – 2017) calls for the development of urban planning guidelines that promote compact development and green building principles – elements consistent with low emission urban development.
The Government of Rwanda has requested UN-Habitat’s support in developing a Smart Cities Framework. This initiative, which will help Rwandan cities adopt a smart city approach, offers an entry point to low-emission development and related policy dialogues. Rwanda’s NDC also offers potential entry points for Urban-LEDS with its calls for increasing public transport, establishing eco-industrial parks, and recognizing that urban waste represents a potential resource stream. District officials can apply directly to the Government’s Environment and Climate Change Fund (FONERWA) for funds to support climate action and they have benefited from targeted assistance from the Climate and Development Knowledge Network (CDKN) to improve the quality of their submittals. The cities participating in the project receive support to develop Low Emission Development Strategies, GHG emission inventories, climate commitments and to implement a variety of low emission development solutions – see page At a glance and Achievements.
Led by: ICLEI Africa Secretariat.
Supported by: UN-Habitat Rwanda Office, Regional Office for Africa
Contact us
ICLEI Africa Secretariat
3 Knowledge Park, Century City, Cape Town
Tel: +27212020381
Fax: +27 87 809 6185
E-mail: [email protected]
UN-Habitat Rwanda Office, Regional Office for Africa
E-mail: [email protected]
| Size of population (year) | 11,800,000 (2017) |
| Size (km²) | 26,338 |
| Population density (year) | 414 inhabitants/ km2 (2012) |
| Official language(s) | Kinyarwanda, English and French, Swahili |
| Time Zone | +2:00 UTC |
| GDP per capita | 1,751 billion (2018) |
| Annual GDP Growth rate | 5% |
| % of population living in poverty | 36,7% (DNP) |
| Unemployment rate | 16 % |
| Link to updated NDC | Click here |
Country achievements
Coming soon
- Energy Demand
- Industry
- Energy Supply
- Transportation
- Agriculture
- Waste
| Source | % |
|---|---|
| Energy Demand | 23,2% |
| Agriculture | 70,2% |
| Industry | 4,1% |
| Waste | 0,8% |
| Transport | 0,8% |
| Energy Supply | 0,9% |
Cities
Huye
Kigali
Muhanga
Nyagatare
District of Musanze
Rubavu
Rusizi
See tabs below for city profiles.
Information forthcoming.
| Size of population (year) | 328,398 (2012) (District); 52,768 (Urban centre) (NISR, 2013; WBG, 2017) |
| Size (km²) | 581.5 |
| Population density (year) | 565 inhabitants/km2 (2017) |
| Official language(s) | Kinyarwanda, English, French |
| Major economic activities in the city | Agriculture |
| Population growth trend | 2.7 % (2002-2012)
1.9% (2002-2012) (city urban population growth rate) |
| % of population living in urban areas | 16.1% (2012) |
| Average annual rate of urbanization | 1.9% |
| Greenhouse Gas emissions (total in C02e/year) | – |
| City official website | Click here |
The City of Kigali is the capital city of Rwanda, and has been since Rwandan independence in 1962. The city is comprised of three districts: Kicukiro, Gasabo, and Nyarugenge, and 35 sectors. The city’s vision is to make Kigali the “Center of Urban Excellence in Africa”, which the city has identified 3 pillars to support: social inclusion, sustainable development, and economic growth. The City of Kigali is Rwanda’s economic, cultural, and transport hub. The City is also connected internationally by the Kigali International Airport located in the heart of Kigali.
Kigali is the Capital and largest City of Rwanda, geographically located at the heart of Rwanda. The City is well known for its numerous hills spread across the four ridges with valleys in between and southern wetlands. The climate is tropical with annual average high temperatures of 26.9°C and low temperatures of 15.7°C, with annual precipitation of 950.9mm.
| Size of population (year) | 1,132,686 (2012) |
| Size (km²) | 730 km² |
| Population density (year) | 1, 552 persons/km² (PHC4, 2012) |
| Official language(s) | Kinyarwanda, English, French, Swahili |
| Major economic activities in the city | Over 500,000 people work in the city and are mainly, employed in the fields of public administration, safety, healthcare and social assistance, education and training, retail trade and professional, scientific and technical services among others. These city workers do not only consist of Kigali residents but also workers from other districts. The tourism and construction sectors in Kigali are growing significantly. The City accounts for 39% of all non‐farm wage‐employment in the country and more than 50% of all formal private sector firms and employment in those firms. Primary sector: Agriculture accounts for 22% of all employment. Secondary Sector: Industry accounts for 21% of all employment. Tertiary Sector: Services accounts for 57% of all employment. (Sub Sector Employment Projections 2011-2020)
|
| Population growth trend | 4.2% (2011). City of Kigali’s population grew by 148% from 2002 – 2012. |
| % of population living in urban areas | 73.8% (EICV 5) |
| Average annual rate of urbanization | 4.2% (2017) |
| Greenhouse Gas emissions (total in C02e/year) | 837,204 (2017) |
| City official website | Click here |
Greenhouse Gas emissions by sector
- Stationary Energy
- Transport
- Waste
| Source | Amount (tCO2e) | % |
|---|---|---|
| Stationary Energy | 136,729 | 16.3% |
| Transport | 272,009 | 32.5% |
| Waste | 428,466 | 51.2% |
Muhanga is located in the southern province of Rwanda, West of city of Kigali, it’s also one of the eight districts comprising the Southern Province. It is subdivided into twelve (12) sectors, sixty-three (63) cells and three hundred and thirty-one (331) villages (Imidugudu). The District covers an area of six hundred forty-seven point seven square kilometres (647.7 km2) and, it is neighbouring the Districts of Gakenke in the North, Kamonyi in the East, Ruhango in the South and Ngororero in the West.
Muhanga (DDP: 2013-2018) describes the District as a Secondary City located fifty Kilometres (50 km) from the City of Kigali (CoK). Muhanga District is among the areas that supply the City of Kigali with food especially vegetables, fruit and meat of small livestock, mainly pork. Muhanga District is also located at the juncture between Kigali and the Southern and Western Provinces, the Republic of Burundi and Eastern of Democratic Republic of Congo. Major towns of Southern Province connected to Muhanga Secondary City are Ruhango, Nyanza, Huye and Nyamagabe, while those of the Western Province are Ngororero and Karongi. It is also connected to the Mayaga, region rich in agricultural production. One part of Muhanga District is located in the “central plateau” of the country with topography of hills type. The other part of the District is on the high mountains of the Nil-Congo; it has peaks prancing beyond 2000 meters (Saruheshyi, Kanyarira, Mukingi and Samba).
This strategic location makes Muhanga Secondary City an economic pole that strives for development in trade and other businesses in the Southern part of the country by supplying goods and services but also a transit point for the supply of food in Kigali. Three (3) sectors were selected as urban administrative boundaries of Cyeza, Nyamabuye and Shyogwe are sector with high population density.
The District is located in an area well-watered, between 1100 mm and 1200 mm of altitude. This region enjoys a climate of four seasons of which two rainy seasons and two dry seasons: a short rainy season, which extends from October to December, a short dry season that runs from January to February, and a long rainy season from March to June and a long dry season from June to August or early September. The District is located mainly in the agro-bio-climatic region called “Granite Ridge”.
The district’s vegetation predominantly made up of crops and artificial forests. The crops consist of large banana with the combination of avocado, sweet potatoes, cassava, etc. The majority of the current afforested consists of Eucalyptus, Pinus and and few grevilleas especially on the lines conservation tillage.
(Source: District of Rubavu District Development Strategy, 2018)
| Size of population (year) | 319,141 (2012) |
| Size (km²) | 647.7 km² |
| Population density (year) | 1,333 persons/km² (source: State of environment and outlook 2017, p.8) |
| Official language(s) | Kinyarwanda, French, English |
| Major economic activities in the city | The districts key economic sectors included infrastructure development, agriculture and private sector development.
Data on sector contributions were not available. |
| Population growth trend | 2.6% (Source: Green Secondary City Strategy, 2012) |
| % of population living in urban areas | 15.86% (2012) |
| Average annual rate of urbanization | Population grew by 111% between 2002 – 2012. Expected growth of urban population between 2012 – 2020: 121% (Green Secondary City Strategy, 2012) |
| Greenhouse Gas emissions (total in C02e/year) | 69,096 (2017) |
| City official website | Click here |
Greenhouse Gas emissions by sector
- Stationary Energy
- Transport
- Waste
| Source | Amount (tCO2e) | % |
|---|---|---|
| Stationary Energy | 22,087 | 31.6% |
| Transport | 16,703 | 24.4% |
| Waste | 30,306 | 44% |
Information forthcoming.
| Size of population (year) | 466,944 (2012) |
| Size (km²) | 1741.0 |
| Population density (year) | 242 inhabitants/km2 (2017) |
| Official language(s) | Kinyarwanda, English, French |
| Major economic activities in the city | Agriculture |
| Population growth trend | 7.9 (2002-2012) (city urban population growth rate) (WBG, 2017) |
| % of population living in urban areas | 10.2% (NISR, 2013) |
| Average annual rate of urbanization | 7.9 (WBG, 2017) |
| Greenhouse Gas emissions (total in C02e/year) | – |
| City official website | Click here |
Information forthcoming.
| Size of population (year) | 368,264 (2012) (carbonn Center) |
| Size (km²) | 530.0 |
| Population density (year) | 694 inhabitants/km2 (2017) |
| Official language(s) | English, Kinyarwanda, French |
| Major economic activities in the city | Agriculture |
| Population growth trend | 1.8% (2012) (District Development Plan 2013 – 2018) |
| % of population living in urban areas | 27.7% (2012) (NISR, 2013) |
| Average annual rate of urbanization | 3.3% (WBG, 2017) |
| Greenhouse Gas emissions (total in C02e/year) | – |
| City official website | Click here |
Rubavu District is one of 30 districts in Rwanda and one of the 7 districts comprising the Western province of Rwanda, 152 km from Kigali City. It has a total surface area of 388.3 km2. It borders the Nyabihu District in the east, the Democratic Republic of Congo t0 the north and west, and the Rutsiro district to the south. That geographical location helps Rubavu establish itself as a business, cross-border trade, and tourism hub. The District of Rubavu is composed by 12 administrative sectors, 80 Cells and 525 Villages, with the main urban center being Gisenyi located on the border with the DRC. Rubavu is the only District in Rwanda where agriculture employs less than 50% of the workforce (District of Rubavu District Development Strategy, 2018).
The District has an equatorial climate with an average altitude. Average temperature ranges from 15 °C on the vertices, 20 ° C at borders of Lake Kivu, and night time temperatures that can drop to 6 ° C. Rubavu District belongs to the Kivu Nile and Sebeya catchments which serve as the main sources of water for the district and neighboring districts. Rainfall in Rubavu District varies between 1200 mm and 1500 mm per year. The Land of North-west District has a very rich but shallow, volcanic ash and lava decomposed soil, while land southeast have deep soils but poor, often acidic, sandy clay, leached by high erosion. Agricultural biodiversity includes maize, beans, pyrethrum, coffee and tea, among others, contributing to the region’s food security and livelihood. The forest resources act as important watershed functions that provide water for domestic and industrial use, allow for energy generation, and keep water bodies free of siltation (District of Rubavu District Development Strategy, 2018).
| Size of population (year) | 403,662 (2012) |
| Size (km²) | 388.3 km² |
| Population density (year) | 1,039 persons/km² (source: State of environment and outlook 2017, p.8) |
| Official language(s) | Kinyarwanda, French, English |
| Major economic activities in the city | Agriculture, tourism, and business Services |
| Population growth trend | 5% (Source: Green Secondary City Strategy, 2012) |
| % of population living in urban areas | 37% (2012) |
| Average annual rate of urbanization | Population grew by 137% between 2002 – 2012. Expected growth of urban population between 2012 – 2020: 182% (Green Secondary City Strategy, 2012) |
| Greenhouse Gas emissions (total in C02e/year) | 89,473 (2017) |
| City official website | Click here |
Greenhouse Gas emissions by sector
- Stationary Energy
- Transport
- Waste
| Source | Amount (tCO2e) | % |
|---|---|---|
| Stationary Energy | 22,634 | 25.3% |
| Transport | 15,940 | 17.8% |
| Waste | 50,899 | 56.9% |
Information forthcoming.
| Size of population (year) | 404,714 (2017) (District Development Plan, 2013 – 2018) (28,488 Urban centre population) (WBG, 2017) |
| Size (km²) | 940.95 km2 |
| Population density (year) | 418 inhabitants /km2 (NISR, 2017) |
| Official language(s) | Kinyarwanda, English, French |
| Major economic activities in the city | Agriculture |
| Population growth trend | 1.1 % (2002-2012) (City urban population growth rate) |
| % of population living in urban areas | 15.8% (2012) |
| Average annual rate of urbanization | 1.1% |
| Greenhouse Gas emissions (total in C02e/year) | – |
| City official website | Click here |
News from the country
How Rwanda is making its cities resilient and providing its people with secure, healthy futures
Rwanda has ambitious plans for taking climate action and its cities are feeding into these plans with tangible actions that will not only contribute to the […]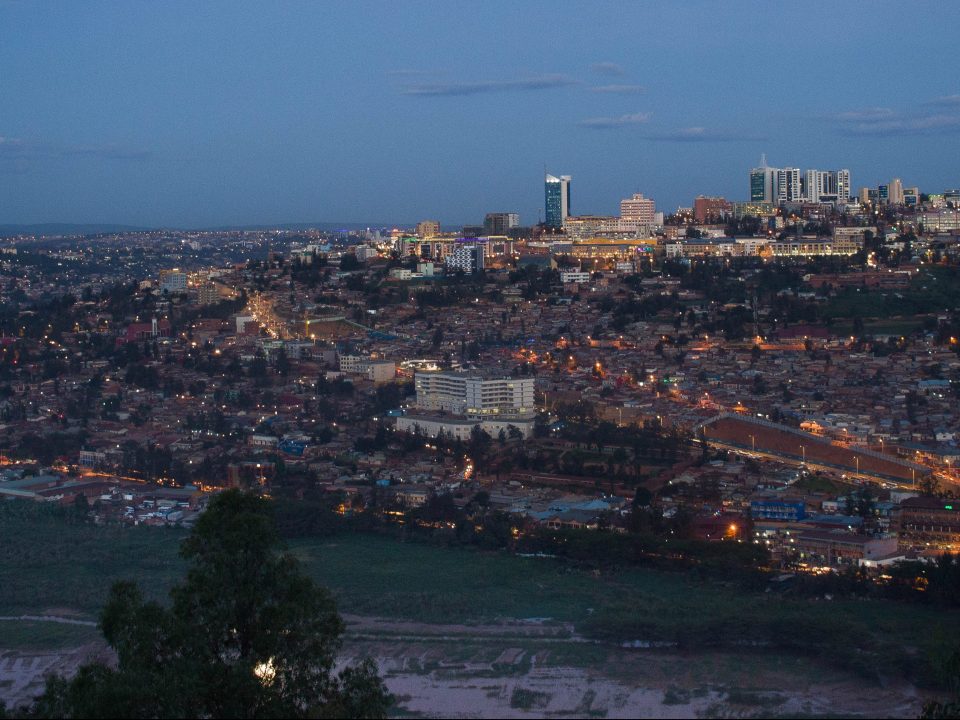
Rwanda upgrades healthcare centres as part of green economic recovery
The centres in Kigali and Muhanga are partnering with Urban-LEDS II to improve resource-efficient access to water and electricity. These upgrades will respond to the pandemic […]
Using GIS to calculate the importance of land use management to achieve Net Zero Targets in Africa’s Cities
Within the Rwandan National Biodiversity Strategy and Action Plan (NBSAP), the long-term vision for economic and social prosperity is expressed clearly as having to be realised […]
Urban-LEDS ll cities in Africa show their commitment to climate action in 2020 through virtual engagements
Faced with the logistical constraints which the COVID-19 crisis has brought about in 2020, but acknowledging that the need to build back stronger and more sustainably […]