India
India has committed to reduce its GDP (Gross Domestic Product) emission intensity by 33-35% compared to 2005, installation of 40% cumulative electric power from non-fossil fuel energy sources, and increased tree cover to create an additional carbon sink of 2.5 to 3 gigatons of CO2 equivalent by 2030. India is committed to a number of strategies, which are highly relevant to local governments, such as cleaner and more efficient thermal generation stations, reducing emissions from the transport and waste sectors, and promoting energy efficiency in the industrial, transportation, building, and utility sectors.
India’s NDC seems to offer strong potential for vertically integrated climate action and reporting, although currently the federal ministries required for such engagement have not agreed on an approach. You can download India’s latest NDC here.
Led by: ICLEI South Asia Secretariat.
Supported by: UN-Habitat India Country Office
About India
The Urban-LEDS project Phase I was implemented in India, where a total of eight cities participated. Two Model cities, Rajkot and Thane, as well as six Satellite cities received support to develop Low Emission Development Strategies, GHG emission inventories, climate commitments and implement a variety of low emission development solutions. Key achievements are outlined below. In Phase II of the Urban-LEDS project, participating cities will be supported in a review of the progress they have made towards low emission development, with a focus on developing project proposals and seeking funding to implement the action plans developed in Phase I. Where needed, data will be updated, including greenhouse gas inventories and climate change vulnerability risk assessments.
Two cities that participated in Urban-LEDS Phase I (Rakjot and Nagpur) are also participating in India’s innovative Smart Cities initiative, cited in the country NDC. Smart Cities enjoy increased access to resources earmarked for urban investments, including by establishing Special Purpose Vehicles (SPVs). Such provisions represent an opportunity for cities to finance some of their low emissions priorities.
The National Project Advisory Group (PAG) in India is composed of NIUA – National Institute of Urban Affairs, IGEP, GIZ – Indo-German Environment Partnership Programme, Deutsche Gesellschaft für Internationale Zusammenarbeit, EU Delegation to India, MNRE – Ministry of New and Renewable Energy – India, UN-Habitat India, Schneider Electric India Private Limited, and the KFW Development Bank.
Contact us
ICLEI South Asia Secretariat
Head Office: New Delhi,
C-3, Lower Ground Floor
Green Park Extension,
New Delhi 110016, India
Tel: +91 11 4974 7200
Fax: +91 11 4974 7201
UN-HABITAT Information Office
5th Floor (East Wing),
Thalamuthu Natarajan Building
(CMDA Building), Egmore,
Chennai 600 008, India
Tel: + 9144 2841 1302
Fax: +91 44 2851 6273
E-mail: [email protected]
Results from Phase I
The national project launch workshop was held in New Delhi in September 2013. As Urban-LEDS Phase I finished in 2015, Indian cities had achieved the following:
- Rajkot: In August 2016 the Rajkot Municipal Corporation (RMC) approved and adopted the Urban LED Strategy through a municipal council resolution. The same year, the local government also approved the city’s Low Emission Development Strategy Action Plan for 2015 to 2020. It includes structural and policy interventions with a focus on climate change mitigation as well as adaptation.
- Thane: The Low Emission Development Strategy document was officially submitted to the City Mayor and Commissioner for Council approval in April 2016. Meanwhile, implementation started on several priority Low Emission Development actions, and funding has been secured for further implementation of demonstration projects.
- Panaji: Municipal Corporation has ratified and adopted the Panaji Low Emission Development Strategy (2015/16 – 2019/20) in June 2016, focusing on the City’s priorities and sustainable initiatives.
- All eight Indian cities are reporting to the carbonn® Climate Registry (cCR). You can visit their profiles in the city profiles.
- All eight Indian cities have implemented a range of low-emission development solutions with the help of Urban-LEDS, including: streamlining sustainable development in the urban growth strategy of the city, installation of photovoltaic (PV) panels, and developing LED street lighting projects. To read more about these solutions, download the final Urban-LEDS report or visit the city pages.
Model cities
Nagpur
Thane
Satellite cities
Coimbatore
Gwalior
Panaji
Pimpri-Chinchwad
Rajkot
Shimla
See tabs below for city profiles.
Nagpur city is known as the Orange City due to its abundant cultivation of orange fruit, located at the geographical center of India. Nagpur is third in terms of population in the province of Maharashtra and is the 2nd capital of the state. Due to its geographical location and large infrastructure projects like metro rail and multi-modal international hub for logistics and transport, Nagpur is a rapidly growing city.
Nagpur, the name is derived from the Nag River which curves around the city. Nagpur is geographical centered in India with low land features. The city lies on the Deccan plateau of the Indian Peninsula and has a mean altitude of 310.5 meters above sea level. Nagpur is classified as a city with tropical wet and dry climatic conditions.
| Size of population (year) | 2,435,000 (Census India, 2011) |
| Size (km²) | 227.4 km² |
| Population density (year) | 10,873 hab/km² (City Development Plan, 2015) |
| Official language(s) | Marathi |
| Major economic activities in the city | Primary sector: Nagpur district is mostly known for its agricultural land, with 6,440 km² of cultivable area out of 9,892 km². Agricultural activities largely take place outside the city’s boundaries. Nagpur district is moderately rich in minerals, with deposits of coal, manganese ore, dolomite, limestone, iron-ore, clay, copper ore, chromite, tungsten ore, zinc ore, quartz, etc.. Secondary sector: Nagpur city is surrounded by various industries such as chemicals, cements, electrical, electronics, textile, ceramics, pharmaceuticals, wood & paper based industries. Few IT-industries are also located within the city. Nagpur has a large upcoming Multi-Modal International Hub Airport of Nagpur (MIHAN) project. The proposed MIHAN project is expected to span over 4,025 hectares at a cost of INR 20000 million. Besides the airport, the proposed project involves a road-rail terminal, a special economic zone (SEZ) and other urban amenities which are expected to boost the employment and thereby the economy of the city. Tertiary: Nagpur has various retail and wholesale markets, characterized by small shops and hawkers dealing with various types of goods. The local government has formalized and regulates these markets and establishments. (City Development Plan 2015) |
| Population growth trend | 17% decadal growth rate from 2001-2011 (City Development Plan 2015) |
| % of population living in urban areas | 100% (City Development Plan 2015) |
| Average annual rate of urbanization | 100% urbanization in the city limits. The decadal growth rate of population for 2001-2011 is 17%. |
| Greenhouse Gas emissions (total in C02e/year) | 2,919,182 tonnes of carbon dioxide equivalent (tCO2e) for 2017-18 (Source: Nagpur City GHG Inventory as reported to CDP-ICLEI reporting system, December 2020) |
| City official website | Click here |
Greenhouse Gas emissions by sector
- Residential Buildings
- Commercial and Institutional buildings/facilities
- Manufacturing Industries and Construction
- Transport
- Waste
- Agriculture, forestry and fishing activities
- Rail & Aviation
| Source | Amount (tCO2e for 2017-18) | % |
|---|---|---|
| Residential Buildings | 1,161,880.1 | 40% |
| Commercial and Institutional buildings/facilities | 556,180.3 | 19% |
| Agriculture, forestry and fishing activities | 608.9 | 0.02% |
| Manufacturing Industries and Construction | 133,268.5 | 4.5% |
| Transport | 500,497.5 | 17% |
| Waste | 5,22,314 | 18% |
| Rail & Aviation | 44,433 | 1.5% |
Thane city, located in Maharashtra state, is the second largest city in terms of population in the Mumbai Metropolitan Region. The city is the administrative headquarters of Thane District and is adjacent to the megacity of Mumbai, located directly to the southwest of Thane city. Thane city is transforming its image from an industrial city to service sector with rapid urbanization. Thane has a sought after city to live in due to its strategic geographical location, accessibility for adjoining cities, and service provision.
Thane city mainly has a coastal climate, situated on the Western Ghats of Deccan Plateau along the western coast. The climate in Thane is predominantly warm, sultry, and humid. Although temperatures are not very high in summer, the prevalent weather condition is uncomfortable due to high humidity. A creek also passes through the city.
| Size of population (year) | 1,841,000 (Census of India, 2011) |
| Size (km²) | 128.23 km² (Revised City Development Plan, Draft Report, 2016) |
| Population density (year) | 12,373 hab/km² (2011, Thane Smart City Proposal, 2016) |
| Official language(s) | Marathi |
| Major economic activities in the city | Primary sector: Economic growth in the last couple of decades has been driven by Information technology (IT) industries established in the city with spatial and development policies pursued by the State Government of Maharashtra also contributing to economic development. The IT/ Information technology enabled services (ITES) sector is growing rapidly in Thane, with the city being the preferred location to set up IT industries, after Pune and Mumbai. The key reasons for Thane’s transformation into an IT/ITeS hub are availability of young and qualified workforce, excellent transportation network, social infrastructure, and low cost of operations as compared to the neighboring city of Mumbai. Secondary sector: Many allied businesses have flourished in city as a result of recent development in IT. |
| Population growth trend | 45.85% decadal population growth from 2001 to 2011 (Revised City Development Plan, Draft Report, 2016) |
| % of population living in urban areas | 100% |
| Average annual rate of urbanization | 100% urbanization with a decade population growth of 45.85% between 2001-2011 |
| Greenhouse Gas emissions (total in C02e/year) | 2,287,596 tonnes of CO2e/ year (2017-18) (Source: Thane GHG inventory as reported to CDP-ICLEI reporting system, December 2020) |
| City official website | Click here |
Greenhouse Gas emissions by sector
- Residential buildings
- Commercial and Institutional buildings/facilities
- Manufacturing Industries and Construction
- Transport
- Waste
| Source | Amount (tCO2e) | % |
|---|---|---|
| Residential buildings | 989,820 | 43% |
| Commercial and Institutional building/facilities | 325,851 | 14% |
| Manufacturing Industries and Construction | 250,145 | 11% |
| Transport | 326,057 | 14% |
| Waste | 395,723 | 17% |
Coimbatore is the second largest city in the western part of the State of Tamil, and popularly known as the Manchester of South India, due to its cotton and textile industry. The city is the capital of Coimbatore district and is administered by the Coimbatore Municipal Corporation. Coimbatore has emerged as a resurging entrepreneurial city in the heart of South India. Spread on the Northern banks of River Noyyal, located to the west of Tamil Nadu and bordering the neighboring state of Kerala, Coimbatore acts as an entry and exit point for Udhgamandalam or Ooty, a world famous tourist destination. It is one of the fastest growing cities in India and is a major hub for textiles, industries, commerce, education, information technology, healthcare, and manufacturing. Coimbatore participated as a satellite city in Phase I of Urban-LEDS.
Coimbatore city, with an average elevation of 427 meters above mean sea level, is surrounded by the Western Ghats mountain range on the West and North. It is an area of low rainfall, being the rain shadow region of the Western Ghats. The city geographically falls in the Noyyal’s basin area and is transversed by River Noyyal, a tributary of the River Kaveri.
| Size of population (year) | 1,617,711 (2015-16) |
| Size (km²) | 257 km² |
| Population density (year) | 6294 hab/km² (2011) |
| Official language(s) | Tamil & English |
| Major economic activities in the city | The city’s primary industries are engineering and textiles. Coimbatore is famous for the manufacture of motor pump sets and various engineering products such as textile machinery, automobile spares, motors, electronics, steel and aluminium foundries. The region also houses the country’s largest amount of hosiery and poultry industries. Coimbatore is the second largest producer of software in the state, ranking just below the capital city of Chennai. The Information technology parks in the city have aided the growth of IT and business process outsourcing industries. With good cost-effective telecom connectivity and a large number of qualified software engineers, Coimbatore is more than equipped to meet IT and IT-enabled service requirements. Coimbatore is also one of the major gold jewelry manufacturing hubs in India, renowned for making cast and machine made jewelry, and consequently the production of machinery required for these processes. |
| Population growth trend | 73.78% decadal population growth from 2001 to 2011 |
| % of population living in urban areas | 100% |
| Average annual rate of urbanization | 100% urbanized already |
| Greenhouse Gas emissions (total in C02e/year) | 4,836,259.89 tonnes of CO2e (year 2017-18) (Source: Coimbatore GHG inventory as reported on CDP-ICLEI reporting system, December 2020) |
| City official website | Click here |
Greenhouse Gas emissions by sector
- Residential Buildings
- Commercial and Institutional buildings/facilities
- Manufacturing Industries and Construction
- Transport
- Waste
| Source | Amount (tCO2e 2017-18) | % |
|---|---|---|
| Residential buildings | 886,313.86 | 18% |
| Commercial and Institutional building/facilities | 501,973.70 | 10% |
| Manufacturing Industries and Construction | 1,384,267.60 | 29% |
| Transport | 1,911,559.28 | 40% |
| Waste | 152,145.45 | 3% |
Gwalior is an important city in the Indian state of Madhya Pradesh, well-known for its art and cultural and historical structures. Being situated at a distance of 319 kilometers to the south of India’s capital city of Delhi, Gwalior occupies a strategic location. Gwalior is one of the largest cities in central India and has been identified as a counter magnet city to the National Capital region. The city is well connected via rail, road, and air transport services. Gwalior participated as a satellite city in Phase I of Urban-LEDS.
Gwalior is located at 26.22°N 78.18°E in the northern part of Madhya Pradesh state. It has an average elevation of 197 meters. Gwalior has a subtropical climate, experiencing hot summers from late March to early July, a humid monsoon season from late June to early October, and a cool dry winter from early November to late February. The maximum temperature during summers can reach about 46°C and the minimum temperature in the winter can go as low as 5°C. Gwalior receives 970 mm of rainfall every year, most of which occurs in the monsoon months from late June to early October.
| Size of population (year) | 1,054,000 (Census India, 2011) |
| Size (km²) | 289.85 km² |
| Population density (year) | 6,292 hab/km² |
| Official language(s) | Hindi, Marathi |
| Major economic activities in the city | Gwalior’s economy is driven by trade and commerce, small scale industries, tourism and textiles. Primary sector: Stone mining is a significant economic activity, with over 200 stone mines situated in the Gwalior Region. Secondary sector: Two large industrial estates, the Malanpur‐Ghirungi to the North East and Banmore to the northwest, are in close proximity to the city, located within a radius of 20 km radius. Important industries include engineering, chemicals, consumer appliances, food manufacture, and automobiles. Recent years have seen decline of traditional industries, particularly ones within the city area and at present most of the industries are located outside the city. Tertiary: Gwalior city’s economic activities mostly fall under tertiary sector as many small scale industries for food, packaging, cold storage, oil-paint, plastic, printing press, and light engineering exist in the city. Gwalior is well known for its handicraft industry producing hand-woven carpets, stoneware, and sculptures. Around 20,000 carpet units and 1,000 sandstone units operate informally within the city. |
| Population growth trend | 25% decadal growth rate from 2001-2011 |
| % of population living in urban areas | 100% |
| Average annual rate of urbanization | 100% urbanization in the city limits. The decadal growth rate of population for 2001-2011 is 25%. |
| Greenhouse Gas emissions (total in C02e/year) | 1,195,240 tonnes of CO2e for the baseline year 2013-14 (Source: Gwalior City GHG Inventory report prepared under Urban LEDS I) |
| City official website | Click here |
Greenhouse Gas emissions by sector
- Residential buildings
- Commercial and Institutional buildings/facilities
- Manufacturing Industries and Construction
- Transport
- Agriculture, forestry and fishing activities
- Waste
| Source | Amount (tCO2e) | % |
|---|---|---|
| Residential buildings | 435,295 | 36% |
| Commercial and Institutional buildings/facilities | 78,595 | 7% |
| Manufacturing Industries and Construction | 215,411 | 18% |
| Agriculture, forestry and fishing activities | 5,990 | 0.5% |
| Transport | 306,117 | 26% |
| Waste | 153,832 | 13% |
Panaji City, administered by the ‘Corporation of the City of Panaji’ (CCP), is the administrative and political capital of the state of Goa, located along the western coast of India. As one of the fastest growing cities in Goa, Panaji lies within the Konkan region, and is well connected to all parts of the country by road, rail, and air network. With Goa being a popular national and international tourist destination, the city acts as a major tourist hub of the state as well as trade and commerce center for the region. Panaji participated as a satellite city in Phase I of Urban-LEDS.
Panaji lies on the bank of the River Mandovi and is bounded by two creeks, sitting at an average elevation of seven meters above mean sea level. Panaji is the state capital and district headquarters of North Goa district with rich historical, political, commercial, educational, cultural and tourist significance. The unique location of the city by the Mandovi River and the Arabian Sea enables it to have the services of inland waterways and a state port.
| Size of population (year) | 40,019 (2011, Revised City Development Plan of Panaji 2041) |
| Size (km²) | 8.12 km² (Revised City Development Plan of Panaji 2041) |
| Population density (year) | 4,928 hab/km² (2011) |
| Official language(s) | Konkani and Marathi |
| Major economic activities in the city | The economy of Panaji is based on tourism, hospitality, trade, and commerce. Tourism is Goa’s primary industry and the state accounts for 12% of all foreign tourist arrivals in India. Tourism based art and artifacts also contribute towards the economy of Panaji. Panaji is the administrative center of the state and also serves as the market center for the adjoining towns and cities. Agriculture is the secondary economic activity, with key crops such as paddy, cereals (millets/pulses and oil seeds), sugarcane, coconut, areca nut and cashew nut cultivated. While the city of Panaji does not possess any industrial establishments, there are a number of industries within a radius of 15 km from the city. |
| Population growth trend | 1.54% average decade growth rate from 2001-2011 (Census of India, 2011) |
| % of population living in urban areas | 100% on an average, 15,300 is the floating population per day (Final City Sanitation Plan – Panaji June 2015) |
| Average annual rate of urbanization | 100% urbanized and population growth of 1.54% |
| Greenhouse Gas emissions (total in C02e/year) | 144,599 tonnes of CO2e for 2013-14 (Low Emission Development Strategies -LEDS- for Panaji City, 2015 prepared under Urban-LEDS I) |
| City official website | Click here |
Greenhouse Gas emissions by sector
- Residential Buildings
- Commercial and Institutional buildings/facilities
- Manufacturing Industries and Construction
- Transport
- Waste
| Source | Amount (tCO2e) | % |
|---|---|---|
| Residential Buildings | 36,345 | 25% |
| Commercial and Institutional buildings/facilities | 44,264 | 31% |
| Manufacturing Industries and Construction | 672 | 0.5% |
| Transport | 55,406 | 38% |
| Waste | 7,912 | 5% |
The city of Pimpri-Chinchwad is situated near the western part of the Deccan Plateau close to the Western Ghats. Pimpri -Chinchwad had been developed as a supporting township for the city of Pune, located at a distance of 15 km away, and forms a continuous urban stretch, adding to the overall Pune urban agglomeration. It is the fifth most populated city, and one of the most vibrant industrial and urban settlements in the state of Maharashtra. Pimpri-Chinchwad hosts a thriving industrial belt consisting of engineering, automobile, pharmaceutical, and biotechnology industries. In recent years, the city has been going through a major transformation, with high growth in residential, retail, and commercial activities. The city participated as a satellite city in Phase I of Urban-LEDS.
The city comprises of the twin towns of Pimpri and Chinchwad situated on the Deccan Plateau and surrounded by hills. The city lies 560 m above sea level, on the banks of the rivers Mula, Pawana, and Indrayani. Pimpri Chinchwad is located to the south-east of Mumbai and in the north-west quadrant of Pune. The city lies along the National Highway, NH-4 leading to Mumbai and is well connected by road, rail, and air to almost all major cities in India. Pimpri-Chinchwad experiences three distinct seasons of summer, monsoon, and winter. The summer season extends typically over the months of March up to May with April being the warmest month with maximum temperatures ranging from 35°-39°C. The city receives moderate annual rainfall of 722 mm, mainly between June and September as a result of the Southwest monsoon. Winter lasts from November till February, with day temperatures around 29°C and night temperatures dipping below 10°C from December to January. The maximum relative humidity during the rainy season is 70-80%, and falls as low as 30% on summer afternoons.
| Size of population (year) | 1,729,359 (Year 2011) |
| Size (km²) | 181 km² (https://www.pcmcindia.gov.in/location_info.php) |
| Population density (year) | 9,554 hab/km² (2011) |
| Official language(s) | Marathi |
| Major economic activities in the city | The region initially had a traditional agro-based economy but has now transformed into an industrial hub and knowledge-driven region in the last 4-5 decades. Today, Pune and its surrounding region comprising Pimpri-Chinchwad city is a cluster for the auto and auto ancillary industries. The emergence of Pune region as a technology destination has also supported the emergence and existence of ancillary and supporting units in Pimpri-Chinchwad. The main drivers of economy in this region are auto and auto ancillary industries, information technology (IT), higher education, bio-technology (BT) hub and agriculture, and the agro and food processing industry. The presence of large-scale core industries has led to the growth of ancillary and small-scale industries in and around this industrial belt. The city is home to major national and multinational automobile and heavy duty engineering industries. In the last decade or so, the economy of Pimpri-Chinchwad has been boosted by a burgeoning IT industry. |
| Population growth trend | 71.83% average decadal growth rate from 2001-2011 (Census of India, 2011) |
| % of population living in urban areas | 100% |
| Average annual rate of urbanization | 100% urbanized already |
| Greenhouse Gas emissions (total in C02e/year) | 3,185,499 tonnes of CO2e for 2012-13 (Source: Pimpri Chinchwad City: Greenhouse Gas Inventory Report 2012-13 prepared under Urban LEDS I) |
| City official website | Click here |
Greenhouse Gas emissions by sector
- Residential Buildings
- Commercial and Institutional buildings/facilities
- Manufacturing Industries and Construction
- Agriculture, forestry and fishing activities
- Transport
- Waste
| Source | Amount (tCO2e) | % |
|---|---|---|
| Residential Buildings | 579,331 | 18% |
| Commercial and Institutional buildings/facilities | 317,648 | 10% |
| Manufacturing Industries and Construction | 1,448,457 | 45% |
| Agriculture, forestry and fishing activities | 2,345 | 0.07% |
| Transport | 653,888 | 21% |
| Waste | 183,830 | 6% |
Rajkot is the fourth largest city in the state of Gujarat, with a population of nearly 1.3 million as of 2011. It is ranked 22nd in the list of global fastest growing cities and urban areas from 2006 to 2020.
The development of the city has been historically driven by industrial activity. With increasing industrial, trade, and commerce activity, there has been tremendous growth in the population of the city. Rajkot is the most populous city in the Saurashtra-Kutch region, with commercial activities spurted by conducive economic and industrial policy. Rajkot is a forerunner among cities in India preparing for a sustainable, low-carbon, and climate resilient future, acting as a model city in Phase I of the Urban-LEDS program.
Rajkot is located 245 km from the state capital Gandhinagar, at the center of the Saurashtra region in the central plains of Gujarat state. The city lies in the Western part of India at 138 m above mean sea level, and is located on the banks of the Aji River and Nyari River. The soil of the entire Rajkot area can be broadly classified as medium black to shallow black. The depth of the topsoil is generally 25 cm to 50 cm deep and this is underlain with soft rock and hard rock formations. The city is well connected to major Indian cities by rail, air and road.
| Size of population (year) | 1,288,599 (Census of India, 2011) |
| Size (km²) | 129.21 km² (2015) |
| Population density (year) | 12,289 hab/km² (Rajkot Municipal Corporation, 2011) |
| Official language(s) | Gujarati |
| Major economic activities in the city | Forging industries, Casting industries, Bearing, diesel engines, cutting appliances, watch and automotive parts, and machine tools manufacturers |
| Population growth trend | 28.3% (Census of India, 2011) |
| % of population living in urban areas | 100% |
| Average annual rate of urbanization | 100.00% |
| Greenhouse Gas emissions (total in C02e/year) | 2,070,171tonnes of CO2e for 2016-17 (Source: Rajkot GHG Inventory as reported on CDP-ICLEI reporting system, December 2020) |
| City official website | Click here |
Greenhouse Gas emissions by sector
- Residential buildings
- Commercial and Institutional buildings/facilities
- Manufacturing Industries and Construction
- Transport
- Waste
| Source | Amount (tCO2e 2016-17) | % |
|---|---|---|
| Residential buildings | 732,028 | 35% |
| Commercial and Institutional buildings/facilities | 218,868 | 11% |
| Manufacturing Industries and Construction | 354,473 | 17% |
| Transport | 467,656 | 23% |
| Waste | 297,146 | 14% |
Shimla is the capital city of the state of Himachal Pradesh in northern India. The city of Shimla is a major tourist desination spanning over several hills and connecting ridges, known as ‘Queen of Hills’ during the British Colonial rule. Shimla district is situated in the catchment area of the rivers Sutlej, Pabbar, and Giri. Shimla is covered by thick forests of pine, rhododendron, and oak. Shimla participated as a satellite city in Phase I of the Urban-LEDS.
Shimla is situated in the north-west part of the Himalayas. It is located at an altitude of 2,205 m in the lower Himalayan range with Jhakhoo hill as the most elevated spur of Shimla. It is identified as a High Damage Risk Zone (Zone IV) as per the Earthquake hazard zoning of India. Shimla has a sub-tropical highland type of climate. The temperature in peak winters (December-January) falls below 0°C. The weather in Shimla is predominantly cool during in winters and moderately cool in summers. The average temperature during winter is between -1°C and 10°C and between 19°C and 28°C in summer. The average total annual precipitation of the city is 1520 mm.
| Size of population (year) | 169,578 (2011 Census of India) |
| Size (km²) | 19.99 km² (Revised City Development Plan of Panaji 2041) |
| Population density (year) | 4,197 hab/km² (2011) |
| Official language(s) | Pahari, Hindi, English |
| Major economic activities in the city | Major economic activities in Shimla city belong to tertiary sector, services mainly related to tourism, with a share of 98% in the economy. Public sector jobs employ almost half (47%) of the working population. About 10% of the employment is in hospitality and tourism sectors. Shimla mainly has small scale industries dealing with crafts, tourist souvenir production, and horticultural produce processing. Large industries are not as prevalent given the uneven hilly terrain and inadequate skilled resources. In addition to being a hub of transportation and trade, Shimla city acts as the region’s healthcare center, hosting a medical college and four major hospitals. The city’s development plan aims to make Shimla an attractive health tourism spot. |
| Population growth trend | 16.21% average decade growth rate from 2001-2011 (Census of India, 2011) |
| % of population living in urban areas | 100% |
| Average annual rate of urbanization | The city is 100% urbanization. The decade growth rate of population for 2001-2011 is 16.21%. |
| Greenhouse Gas emissions (total in C02e/year) | 218,898 tonnes of CO2e for year 2013-14 (Greenhouse Gas Emissions Inventory for Shimla City prepared under Urban-LEDS I) |
| City official website | Click here |
Greenhouse Gas emissions by sector
- Residential Buildings
- Commercial and Institutional buildings/facilities
- Manufacturing Industries and Construction
- Agriculture, forestry and fishing activities
- Waste
- Transport
| Source | Amount (tCO2e) | % |
|---|---|---|
| Residential Buildings | 53,004 | 24% |
| Commercial and Institutional buildings/facilities | 32,689 | 15% |
| Manufacturing Industries and Construction | 1,010 | 0.5% |
| Agriculture, forestry and fishing activities | 29,663 | 14% |
| Transport | 78,598 | 36% |
| Waste | 23,935 | 11% |
News from the country
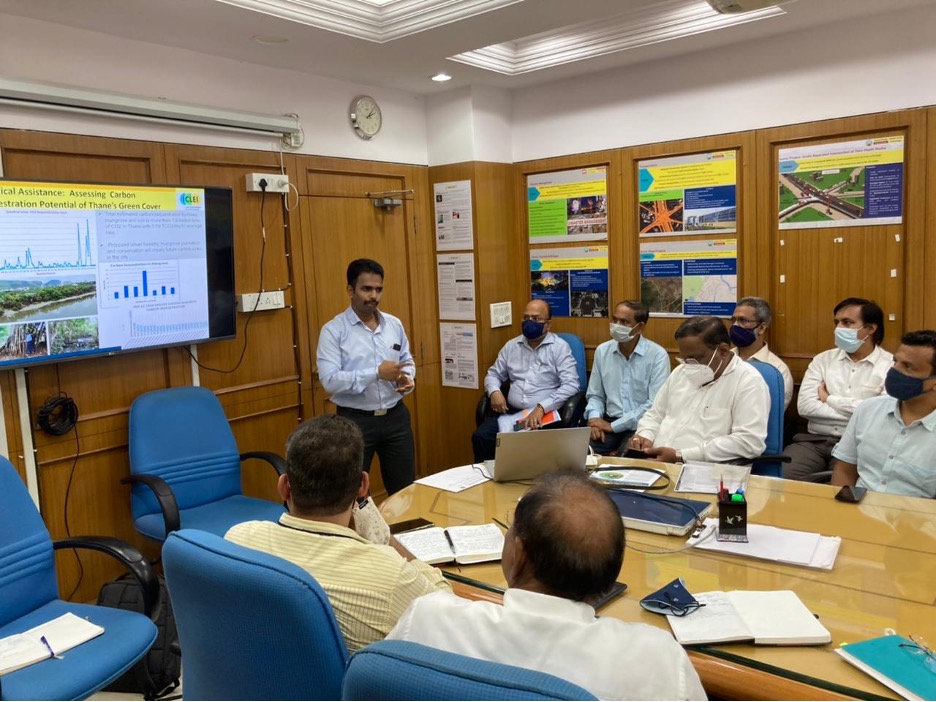
Thane and Nagpur reflect on their new Climate Action Plans and Urban-LEDS II project achievements
The cities of Thane and Nagpur have been able to accelerate their efforts to mainstream and implement climate action with the support of the Urban-LEDS II project. Both […]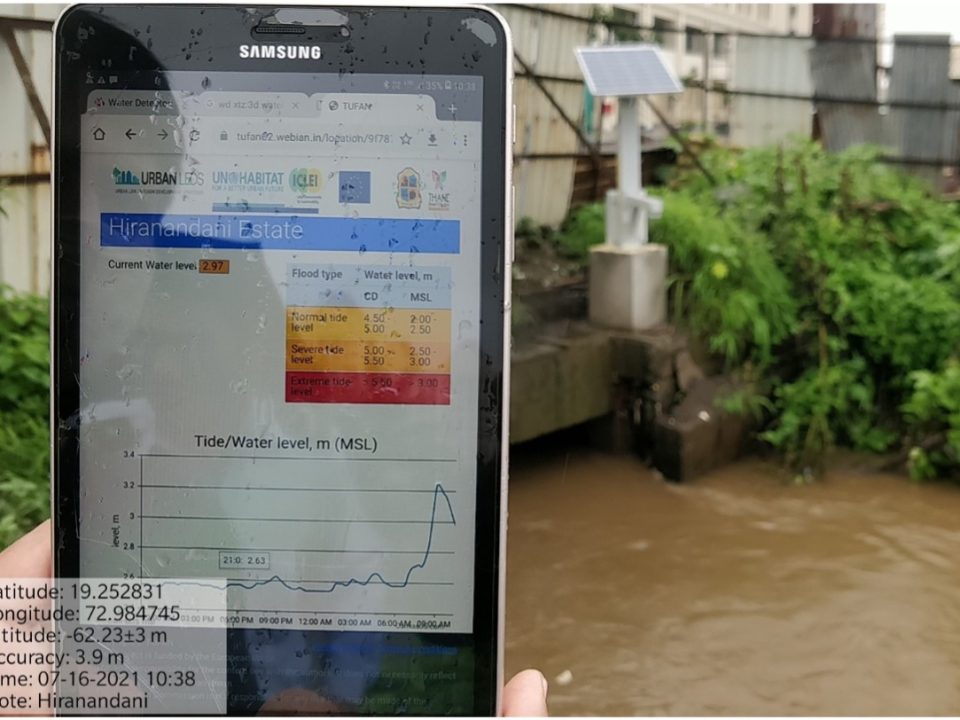
Thane’s Pilot Projects Enhance the City’s Climate Resilience
Thane city has completed the implementation and integration of an early warning system called the Thane Urban Flood Alert Network (TUFAN), to help better address the incidence of […]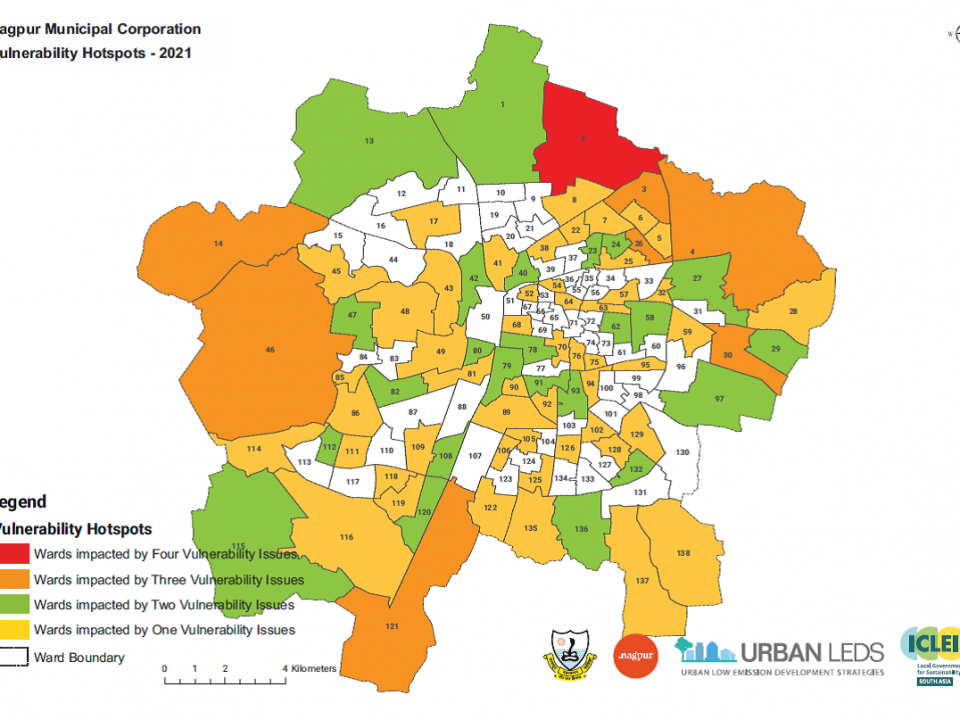
Thane and Nagpur advance on climate resilience planning with completion of climate risk and vulnerability assessments
The Indian cities of Thane and Nagpur have completed their Climate Risk and Vulnerability Assessments (CRVA), with the support of the Urban-LEDS II project. The CRVAs […]
Nagpur advocates for actions to conserve and enhance biodiversity
The Urban-LEDS II project is supporting the Indian city of Nagpur in developing a Local Biodiversity Strategy and Action Plan (LBSAP) that will provide strategic guidance […]