European Cities
Sixteen cities across the wider European region, with a rich diversity of experiences on local climate action, are exchanging their knowledge with the other Urban-LEDS cities in the eight project countries (Bangladesh, Brazil, Colombia, India, Indonesia, Lao PDR, Rwanda and South Africa) to support implementation of Low Emission Development Strategies. This Urban-LEDS International City Network was created to enable local decision-makers and technical municipal staff to share experiences and address concerns with their peers and with experts in national, regional, and international fora.
The European Union is a unique economic and political union between 28 EU countries that together cover much of the continent. The EU is actively promoting Europe’s transition to a low-carbon society, and is updating its rules in order to facilitate the necessary private and public investment in the clean energy transition [1]. The EU has set itself targets for reducing its greenhouse gas emissions progressively up to 2050. Key climate and energy targets are set in the:
|
2020 climate and energy package
|
2030 climate and energy framework
|
These targets are defined to put the EU on the way to achieve the transformation towards a low-carbon economy as detailed in the 2050 long-term strategy. It shows how Europe can lead the way to climate neutrality by investing into realistic technological solutions, empowering citizens, and aligning action in key areas such as industrial policy, finance, or research – while ensuring social fairness for a just transition. The EU tracks its progress on cutting emissions through regular monitoring and reporting. [2]
| Size of population (year) | The EU has 508 million inhabitants – the world’s third largest population after China and India. [1] (2019) |
| Size (km2) | The EU covers over 4 million km² [1]. By surface area, France is the biggest EU country and Malta the smallest. |
| Population density (year) | N/A Specific per country |
| Official language(s) | The EU has 24 official languages. |
| Major religions | N/A |
| Time zone | CET |
| (GDP) (€) – | EU GDP in 2017: €15.3 trillion [1]. |
| Major economic activities in the Region
|
The European Union is the largest trade block in the world. It is the world’s biggest exporter of manufactured goods and services, and the biggest import market for over 100 countries. Free trade among its members was one of the EU’s founding principles. This is possible thanks to the single market. The EU’s main economic engine is the single market. It enables most goods, services, money and people to move freely. [1] |
| Unemployment rate | Europe: 6,3% (May 2019) [3]
Per country: [1] |
| Greenhouse Gas emissions (total in C02e/year) | 4.309.630 ktonnes CO2 (2015) |
Greenhouse Gas emissions by sector
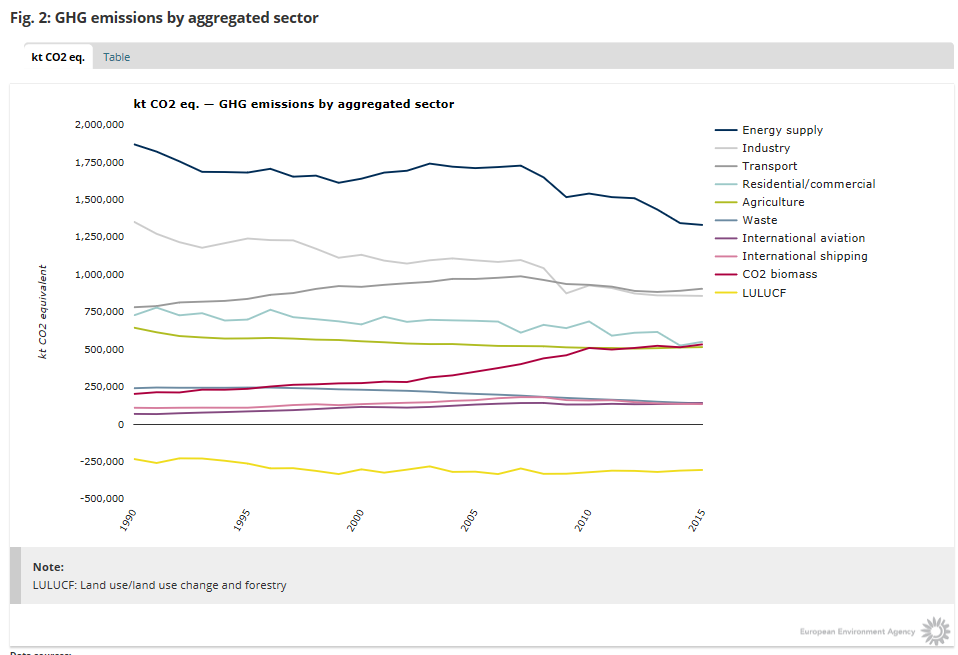
Source. European Energy Agency.
https://www.eea.europa.eu/data-and-maps/indicators/greenhouse-gas-emission-trends-6/assessment-2
References
[1] E. Union, “European Union,” [Online]. Available: https://europa.eu/european-union/index_en
[2] E. Comission, “Energy union and climate,” 2019. [Online]. Available: https://ec.europa.eu/commission/priorities/energy-union-and-climate_en
[3] EUROSTAT, 2019. [Online]. Available: https://ec.europa.eu/eurostat
Selection criteria
The selection of the European cities to be involved has been finalized following the selection of the cities in the project countries. The selection criteria utilized for identifying these cities include size, geographical distribution, climate, sector of expertise, variety of needs and challenges, and best practices to share.
In particular, the aim of the selection was to ensure that the needs of the newly identified cities could be addressed by the European local governments (topic and available staff/time capacity). In addition, an assessment of the European cities topical interested and needs was carried out, to guaranteed a bilateral maximum value from the exchange with the Global South.
Contact us
ICLEI European Secretariat
Leopoldring 3, 79098 Freiburg, Germany
Tel: +49-761 36 89 2-0
Fax: +49-761 36 89 2-19
E-mail: [email protected]
Results from Phase I
In April 2014, 13 cities took part in the European Study Tour “Low Carbon Solutions in Europe”. Host cities Almada, Portugal; Copenhagen, Denmark; and Hannover, Germany; shared their approaches to waste-to-energy systems, buildings, district energy systems, and sustainable transportation solutions. The tour was a successful peer-learning and experience-sharing event. The Mayor of Recife, Brazil, for example was impressed by the green roofs project and availability of bike lanes in Copenhagen, which inspired the city’s 2014 Green Roof Law as well as an expansion of bicycle lanes with the river restoration program in Recife. Other regional and global events used for networking, experience sharing, and training included the ICLEI World Congress 2015, Metropolitan Solutions 2014, and the Local Climate Solutions for Africa Congress (LOCS) 2015.
The Urban-LEDS European cities also benefited from this project, and established valuable cooperation with their counterparts from the Model Cities (not through direct one-to-one twinning but rather using an ad hoc approach as interests emerged and then facilitated connection). This was largely as a result of the staff exchanges and study tour that took place within the project. Thanks to these activities the European cities gained insight on the visions of the Model Cities, and were able to successfully inspire and provide hands-on examples and ideas for speeding up local low-carbon development.
Staff exchanges were organized in 2015 and early 2016 to provide in-depth support to the Model Cites on topics of their choice. The purpose of the staff exchange was to visit the European cities to explore details of local low-emission policies and measures, be inspired, and explore how these could be successfully transferred (where relevant) to their own local context. City representatives from 6 Model Cities participated, with 4 European cities acting to host one or two people from the Global South. The staff exchanges that had been organized are as follows:
- The chief planner from KwaDukuza (South Africa) engaged in a one week staff exchange in Helsinki, Finland, in October 2015 to learn more about the European cities approach to green buildings and the integration of sustainability into urban planning.
- The administrative head of the city of Thane (India) visited Zagreb (Croatia) in March 2016 to explore examples of citizen engagement, energy efficiency through sustainable urban mobility, and sustainable buildings.
- The Spatial and Environment Subdivision of the Municipality of Bogor took part in a one week staff exchange in Warsaw, Poland in November 2015 based on the Indonesian city’s interest in Warsaw’s LEDS and green growth vision.
- The City of Bologna, Italy, hosted the Assistant Director of local Economic Development in Steve Tshwete Municipality, South Africa, alongside the Executive Secretary for the Environment and Sustainability of Recife, Brazil, in December 2015. The delegates gained insight into Bologna’s sustainable energy action plan, and the use of public-private partnerships to deliver this.
Cities
Almada, Portugal
Bologna, Italy
Helsinki, Finland
Hannover, Germany
Warsaw, Poland
Bratislava, Slovakia
Riga, Latvia
Alba lulia, Romania
Madrid, Spain
Aalborg, Denmark
Budapest, Hungary
Cork, Ireland
Larissa, Greece
See tabs below for city profiles.
Almada participated in Urban-LEDS I. Almada is a ICLEI GreenClimateCities (GCC) Europe Ambassador and has committed to test the program, provide feedback, and represent GCC Europe in their country and globally. This helps facilitate links and provide support to other local governments wishing to use the GCC methodology to create a global community and network of peers. Almada is taking active action to reduce city-level climate emissions and providing an example for other rapidly growing cities on how a city’s growth and determined reduction in climate emissions can be implemented.
It is located on the left bank of the Tagus River, bordering the municipality of Seixal in the east and the municipality of Sesimbra in the south. To the west the municipality of Almada is surrounded by the Atlantic Ocean. It belongs to the district of Setúbal and the Metropolitan Area of Lisbon. The city has 35 km of continuous border with the Atlantic Ocean and the Tagus River, mostly covered by requalification projects.
| Size of population (year) | 169,241 inhabitants (2017) |
| Size (km2) | 70.2 km² |
| Population density (year) | 2,479 inhab/km² (2011) |
| Official language(s) | Portuguese |
| Major economic activities in the city | Situated a few minutes from the capital of the country, served by important road infrastructures and a wide public transport network, Almada is especially attractive in the areas of tourism, small industries, research, technology, commerce and services.
After a time of strong industrialization, Almada is now a municipality where the sectors of education, local administration, public enterprises, and health are highlighted. Trade also stands out due to its dynamism and potential. |
| Unemployment rate | 6.7 (2017) |
| GDP | €3 218 million (based on national GDP`*inhabitants (EUROSTAT)) |
| Greenhouse Gas emissions (total in C02e/year) | 291,735.181 tCo2e (2013) |
| City official website | Click here |
Greenhouse Gas emissions by sector
- Transport
- Residential
- Tertiary
- Industry
- Municipal
| Source | Amount tCO2e | % |
|---|---|---|
| Transport | 95,965.402 | 33.48% |
| Residential | 93,011.62 | 32.45% |
| Tertiary | 71,979.95 | 25.12% |
| Industry | 17,342.05 | 6.05% |
| Municipal | 8,302.043 | 2.90% |

Bologna is the capital of Emilia-Romagna region, in northern Italy and is Italy’s 7th largest city in population. Bologna participated in Phase I of Urban-LEDS and is a ICLEI GreenClimateCities (GCC) Europe Ambassador, committed to testing the program, providing feedback, and representing GCC Europe in their country and globally. This helps facilitate links and provide support to other local governments wishing to use the GCC methodology to create a global community and network of peers.
Bologna is taking active action to reduce city-level climate emissions and providing an example for other rapidly growing cities on how a city’s growth and simultaneous determined reduction in climate emissions can be implemented.
The city Bologna is located in the Emilia Romagna Region, which lies between the River Po to its north and the Apennine Mountains to its south. It is one of the most fertile and productive agricultural regions of Italy, thanks to the mitigating effect that the Adriatic Sea has on the coastal climate. The topography surrounding Bologna is diverse and spreads over the plain of Po River Valley, along the Reno and the Panaro Rivers, in the hills and mountains, along the backbones of the Santerno and Senio Rivers to the east, and the Dardagna in the west.
| Size of population (year) | 389,261 inhabitants (2017) |
| Size (km2) | 716.75 km² |
| Population density (year) | 2,763 inhab/km² (2017) |
| Official language(s) | Italian |
| Major economic activities in the city | Bologna is of paramount importance as a road and rail center. The city is an important agricultural market and food-processing center, but also has developed into an important industrial center as well. Its chief manufactures include agricultural machinery, electric motors, motorcycles, railway equipment, chemicals, and shoes. |
| Unemployment rate | 5,1 % (year 2017) |
| GDP | € 37033 (2010) |
| Greenhouse Gas emissions (total in C02e/year) | 2,451,798.88 tCo2e (CoM) |
| City official website | Click here |
Greenhouse Gas emissions by sector
- Residential
- Tertiary
- Transport
- Industry
- Other
- Municipal
| Source | Amount tCO2e | % |
|---|---|---|
| Residential | 787,378.42 | 39.35% |
| Tertiary | 628,019.43 | 31.38% |
| Transport | 332,732.81 | 16.63% |
| Industry | 196,531.41 | 9.82% |
| Other | 30,793 | 1.54% |
| Municipal | 25,678.29 | 1.28% |

Helsinki is the capital and largest city of Finland, on the shore of the Gulf of Finland of the Baltic Sea. Helsinki was the first European capital with a comprehensive sustainable development action plan in 2002. Helsinki has participated in Phase I of URBAN LEDS and is an ICLEI GreenClimateCities (GCC) Europe Ambassador and has committed to test the program, provide feedback, and represent GCC Europe in their country and globally. This help facilitate links and provide support to other local governments wishing to use the GCC methodology to create a global community and network of peers. Helsinki is taking active action to reduce city-level climate emissions and providing an example for other rapidly growing cities on how a city’s growth and simultaneous determined reduction in climate emissions can be implemented.
Helsinki is geographically situated on the southern peninsula by the Gulf of Finland. Facing Tallinn, Estonia, across the bay, a number of islands, which are part of Helsinki, can be reached via boats and ferries. North of Helsinki leads to other cities in Finland and connects to the borders of Sweden and Russia. Called the “Daughter of the Baltic”, Helsinki is on the tip of a peninsula and on 315 islands. Located on the shore of the Gulf of Finland, it is the seat of the region of Uusimaa in southern Finland. Together with the cities of Espoo, Vantaa, and Kauniainen, and surrounding commuter towns, Helsinki forms the Greater Helsinki metropolitan area.
| Size of population (year) | 628,208 inhabitants (2016) |
| Size (km2) | 719 km² |
| Population density (year) | 2,964 inhab/km² (2016) |
| Official language(s) | Finnish |
| Major economic activities in the city | Helsinki is one of Europe’s richest capitals. Contributing approximately a third of Finland’s GDP, Helsinki profits on serviced-related IT and public sectors. Having moved from heavy industrial works, shipping companies also employ a substantial number of people. The city is the core of an economic area of 1.5 million people and 700,000 jobs. Approximately 75% of foreign companies operating in Finland have settled in the Helsinki region. In 2009, Helsinki was chosen to be the World Design Capital for 2012. |
| Unemployment rate | 8.4% |
| GDP | € 52.021 (GDP percapita) – Helsinki Region (2015) |
| Greenhouse Gas emissions (total in C02e/year) | 2,451,798.88 tCo2e (CoM, 2015) |
| City official website | Click here |
Greenhouse Gas emissions by sector
- Residential
- Tertiary
- Transport
- Municipal
- Industry
| Source | Amount tCO2e | % |
|---|---|---|
| Residential | 917,087.74 | 37.48% |
| Tertiary | 599,378.03 | 24.50% |
| Transport | 530,516.87 | 21.68% |
| Municipal | 262,177.67 | 10.72% |
| Industry | 137,644.57 | 5.63% |

The City of Hannover is the state capital and economic center of Lower Saxony in Germany. Hannover is a city of international flair with its various trade fairs and events, while also enjoying an outstanding reputation for good business, innovative ideas, and academic excellence. The City of Hannover has participated in the European Study Tour in April 2014. The city of Hannover aims, by the year 2020, to reduce harmful greenhouse gas emissions within the municipal region by 40 percent compared to 1990 levels.
Nearly 40% of the city’s area is covered by gardens and woodlands. The city lies at the confluence of the River Leine and its tributary Ihme, in the south of the North German Plain, and is the largest city of the Hannover–Braunschweig–Göttingen–Wolfsburg Metropolitan Region. The city is not on a coastal location.
| Size of population (year) | 558,799 inhabitants |
| Size (km2) | 20.4 km² (2017, IBGE) |
| Population density (year) | 2,566 inhab/km² |
| Official language(s) | German |
| Major economic activities in the city | Industry has traditionally formed the basis of the City’s economy. However, Hannover has recently developed into a center for service industries, now employing 70% of the working population. The close connection between science, trade, and industry is one of Hannover’s trademarks, and the city is a center for environmental technology. With over 70,000 employees and around 3,600 companies, the healthcare industry plays a key role in the Hannover region as a driver of economic growth as well. |
| Unemployment rate | 7,6 % (year 2018) |
| GDP |
€33.159,4 Mio. (GDP at market prices 2016 in the aggregate) – €78.646 per employed person |
| Greenhouse Gas emissions (total in C02e/year) | 6,246,740.22 tons CO2/year (EU CoM, 2011) |
| City official website | Click here |
Greenhouse Gas emissions by sector
- Residential
- Tertiary
- Industry
| Source | Amount tCO2e | % |
|---|---|---|
| Residential | 1,273,212.07 | 20.4% |
| Tertiary | 621,441 | 9.9% |
| Industry | 4,352,086.33 | 69.7% |

Warsaw is the capital and largest city of Poland. Aspiring to become the “green metropolis”, Warsaw sets itself a perspective goal of ensuring a high standard of living for its residents in conditions of sustainable development and respect for the natural environment. Warsaw is a city that pays a great deal of attention to environmental protection. In keeping with the motto “think globally, act locally,” the city works hard to protect the climate and participated in Phase I of Urban-LEDS. In 2011, Warsaw adopted the Sustainable Energy Action Plan (SEAP), which defined a reduction of CO2 emissions in the city by 20% by 2020, while increasing the share of renewable energy to 20%.
The City of Warsaw has participated in the following Urban-LEDS activities:
- The 2nd International Networking Seminar (Bogor, Indonesia in May 2015)
- The European Study Tour: offered Warsaw an opportunity to learn from Almada’s electric bus system, ‘Flexibus’
- Staff exchange: Warsaw’s carbon-neutral electric buses greatly inspired the delegates from Model Cities Bogor and Balikpapan.
- COP21 in Paris, France in December 2015
Warsaw stands on the Vistula River in east-central Poland, roughly 260 km from the Baltic Sea and 300 kmfrom the Carpathian Mountains. Almost half the urban area of the city is green space with as many as 95 parks. The Vistula is a semi-wild river that runs through Warsaw, that is part of the Natura 2000 network – a habitat for many breeding species of birds threatened with extinction. The clean and well-maintained beaches along the river foster sustainable urban spaces in the city for citizens to enjoy.
| Size of population (year) | 1,764,615 inhabitants (2017) |
| Size (km²) | 517.24 km² |
| Population density (year) | 3,412 inhab/km² |
| Official language(s) | Polish |
| Major economic activities in the city | Warsaw is the largest and most important destination for scientific and business events in Poland. It is a hub for political, economic, scientific, and cultural interests in the entire region of Central and Eastern Europe. Many institutions and organizations from the region have their seats here, naturally guaranteeing an inflow of ideas, innovation, and capital. Warsaw is also seen as an attractive place to do business thanks to its well-developed infrastructure, its human capital, and modern office spaces, which pull in an ever-increasing number of international corporations and organizers of large-scale events. Poland’s capital is also home to budding entrepreneurs and start-ups in the tech and creative sectors. |
| Greenhouse Gas emissions (total in C02e/year) | 11,721,774 tCo2e (2016, CDP 2017) |
| City official website | Click here |
Greenhouse Gas emissions by sector
- Electricity and heat production
- Transport
- Waste management
| Source | Amount tCO2e | % |
|---|---|---|
| Electricity and heat production | 91429837 | 78% |
| Transport | 17582661 | 15% |
| Waste management | 8205248 | 7% |

Bratislava is the capital of Slovakia. It is one of the smallest capitals in Europe, but the country’s largest city. [3]
The city of Bratislava is located on both banks of the Danube-river, the second biggest river in Europe. It spreads at the borders of three countries, neighbouring with Hungary in the south and Austria in the west. [2]
| Size of population (year) | 432,864 (2019) [1] |
| Size (km2) | 367.583 km2 |
| Population density (year) | 1,200/km2 [1] |
| Official language(s) | Slovak |
| Time zone | CET |
| Community Gross Domestic Product (GDP) (€) | The country has a GDP of $106,585. [4]; Bratislava accounts for 26% of the Slovak GDP. [5] |
| Major economic activities in the city
|
Sustains the highest GDP growth in the European Union. Bratislava is the largest financial center in the Slovakia. International companies and big industries locate to Bratislava to conduct business. The city profits from banking, IT, trade, tourism, and service sectors. [6] |
| Population growth trend | 0.2% per year [7] |
| % of population living in urban areas | 53.4% of the population [8] |
| Average annual rate of urbanisation | -0.09% annual rate of change [8] |
| % of population living in poverty | 4.6% in Bratislava, 12% overall [9] |
| Unemployment rate | 3.02% [10] |
| Greenhouse Gas emissions (total in C02e/year) | 2 407 131 tC02e |
Greenhouse Gas emissions by sector
- Residential
- Transport
- Tertiary
- Municipal
- Public lighting
| Source | Amount tCO2e | % |
|---|---|---|
| Residential | 939022 | 39.01% |
| Transport | 816740 | 33.93% |
| Tertiary | 633557 | 26.32% |
| Municipal | 12517 | 0.52% |
| Public lighting | 5055 | 0.21% |
References
- Statistical Office of the Slovak Republic, “Population and migration,” [Online]. Available: https://slovak.statistics.sk
- The Official Website of Bratislava, “Position”, [Online]. Available: https://archive.is/20070927201123/http://www.bratislava.sk/en/vismo5/dokumenty2.asp?u=700000&id_org=700000&id=2011414
- Statistical Office of the Slovak, “Statistical Yearbook of the Slovak Republic 2017”. [Online].
- International Monetary Fund, “Report for selected countries and subjects”. [Online]. Available: https://www.imf.org/external/pubs/ft/weo/2019/01/weodata/weorept.aspx?pr.x=57&pr.y=3&sy=2016&ey=2020&scsm=1&ssd=1&sort=country&ds=.&br=1&c=936&s=NGDP_RPCH%2CNGDPD%2CPPPGDP%2CNGDPDPC%2CPPPPC%2CPCPIPCH&grp=0&a=
- Eurostat, “Bratislava region Economy”, [Online]. Available: https://web.archive.org/web/20060424134927/http://forum.europa.eu.int/irc/dsis/regportraits/info/data/en/sk01_eco.htm
- Bratislava.com, “City info – Economy”, [Online]. Available”: https://www.bratislava.com/v/economy/
- World Population review, “Slovakia Population Growth”, [Online]. Available: http://worldpopulationreview.com/countries/slovakia-population/
- Index Mundi, “Slovakia Demographics Profile 2018”, [Online]. Available: https://www.indexmundi.com/slovakia/demographics_profile.html
- The Slovak Spectator, “Over 12 percent of Slovaks threatened by poverty in 2017”, [Online]. Available: https://spectator.sme.sk/c/20832401/over-12-percent-of-slovaks-threatened-by-poverty-in-2017.html
- The European Job Mobility Portal, “Labour market information”, [Online]. Available: https://ec.europa.eu/eures/main.jsp?catId=2808&acro=lmi&lang=en&countryId=SK®ionId=SK0&nuts2Code=SK01&nuts3Code=null®ionName=Bratislavsky%20kraj

Riga is the capital city of Latvia and its most important cultural, economic and administrative center. Accounting for almost half of the total national GDP, Riga hosts a thriving economic environment, fostered by its strategic position on the Baltic Sea.
The territory of the Riga municipality stands on the shores of the Riga’s gulf, in the eastern part of the Baltic Sea, at the estuary of the river Daugava. The historical center has been acknowledged as a UNESCO World Heritage Site and has an extension of 483 hectares; the surrounding protection zone has an area of 1574 hectares. The city presents several lakes, rivers and green areas, that account for 39% of the total surface of the city
The city has committed itself to sustainable development and the achievement of the Agenda 2030 objectives; as part of URBAN LEDS, Riga would commit itself to low carbon development and climate change action
| Size of population (year) |
643,620 (2019) |
| Size (km2) | 304.05 km2 |
| Population density (year) | 2000/km2 (2019) |
| Official language(s) | latvian |
| Time zone | GMT+2 |
| GDP | €9,67 billion |
| Major economic activities in the city | The main economic sector of the city is trade, accounting for 19% of the city value added. Related to it, Transport and Logistics consist of another 14% of the city value added. At 10% each, industry and scientific services are vibrant sectors of activity of Riga, accounting for its role of Latvian main center. Moreover. Riga hosts 55% of national commercial companies and receives 77% of the total Foreign Direct Investments in the country |
| Greenhouse Gas emissions (total in C02e/year) | 2068000 Tonnes CO2/year (2012) |
| City official website | Click here |
- Buildings, equipments/facilities and industry
- Transport
| Source | Amount tCO2e | % |
|---|---|---|
| Buildings, equipments/facilities and industry | 1793369.6 | 86.72% |
| Transport | 274630 | 13.28% |
Alba Iulia is home of the largest citadel in Romania. Many people call it “Romania’s Spiritual Capital” or “The Capital of the Union.” The municipality likes to consider Alba Iulia Romania’s “Other Capital.” [1] Alba Iulia Smart City aims to intelligently use information, data and technologies capable of responding to the challenges of adaptability, flexibility, sustainable social and economic development, energy and environment.
Alba Iulia is at an altitude of 270 m. The perimeter of the city is defined by the two rivers Ampoi and Sebes and the top of the Apuseni Mountains. [2] The city of Alba Iulia, Alba County is one of the most important urban centers of Romania
| Size of population (year) | 63,536 (2011) [3] |
| Size (km2) | 103.6 km2 |
| Population density (year) | 613.28 residents/km2 |
| Official language(s) | Romanian |
| Time zone | EET |
| Community Gross Domestic Product (GDP) (€) | €609 Million (based on National ppGDP*population)[4] |
| Major economic activities in the city | The city still has traditional industries such as porcelain, textiles and metal-working, as well as food processing. The local authority is trying to attract new businesses to the outskirts of the city. The university and its foreign students are a key asset in this endeavour. According to the World Bank and Moody’s credit rating agency, Alba Iulia Municipality is a city with a strong institutional capacity for planning urban development and attracting finance for urban projects. |
| Unemployment rate | 6,7% [4] |
| Greenhouse Gas emissions (total in C02e/year) | 298 240.260 tonnes CO2/year (2018) |
| City official website | Click here |
Greenhouse Gas emissions by sector
- Transport
- Residential
- Tertiary
- Public lighting
- Municipal
| Source | Amount tCO2e | % |
|---|---|---|
| Transport | 87,801.6 | 29.5% |
| Residential | 79,799.89 | 26.7% |
| Tertiary | 118,783.58 | 39.8% |
| Public Lighting | 2,702.83 | 0.9% |
| Municipal | 9152.36 | 3.1% |
References
- V. A. Iulia, „About,“ [Online]. Available: http://www.visitalbaiulia.com/about#/the-other-capital/
- P. M. A. Iula, „Presentation,“ [Online]. Available: https://www.apulum.ro/index.php/alba_en/detaliu/610
- ICLEI, „ICLEI Members,“ [Online]. Available: https://iclei.org/en/members-search.html?search_query=alba+iulia
- A. I. Municipality, „ The Integrated Strategy for Urban Development 2014-2023,“ 2017. [Online]. Available: https://ec.europa.eu/regional_policy/sources/conferences/udn_espoo/alba_iulia.pdf.
Madrid, the capital of Spain, is a cosmopolitan city that combines modern infrastructures with economic, financial, administrative and service centres. It is the third city in the European Union in terms of population and also contributes to creating the third largest urban agglomeration in Europe.
Madrid is strategically located in the geographic centre of the Iberian Peninsula at an altitude of 646 m above sea level. It’s extensive and beautifully maintained parks and gardens offer inhabitants and visitors the chance to enjoy public spaces, in one of the greenest capitals in Europe. Important communication infrastructures are located in its territory, making it the main logistic centre of Spain and southern Europe.
Madrid joined the Urban-LEDS II initiative in 2019.
| Size of population (year) | 3.182.175 (2018) |
| Size (km2) | 604,47 km2 |
| Population density (year) | 5300 inhabitants/km2 |
| Official language(s) | Spanish |
| Major religions | Catholicism |
| Time zone | GMT |
| Community Gross Domestic Product (GDP) (€) – | 133.129 million euros in 2016 |
| Major economic activities in the city
|
The City of Madrid stands out in the fields of science and technology, with a high level of investment in research and development, notably surpassing the national average as a percentage of GDP. It is also the headquarters of important university centres, including those of a more technological nature, and research centres, both public and private. |
| Population growth trend | 1,24 % from 2017-2018 |
| Unemployment rate | 11,75 (2019) |
| Greenhouse Gas emissions (total in C02e/year) | 10 706 KTons CO2/year (2013) |
| City official website | click here |
Greenhouse Gas emissions by sector
- Residential and Commercial Services
- Industry
- Road Transport
- Other Modes of Transport
- Waste
- Others
GHG Emissions – City of Madrid (2016)
| Emission Source | Amount tCO2e | Percentage |
| Residential and Commercial Services | 5245940 | 49% |
| Industry | 642360 | 6% |
| Road Transport | 2462380 | 23% |
| Other Modes of Transport | 1070600 | 10% |
| Waste | 642360 | 6% |
| Others | 642360 | 6% |
Aalborg is Denmark’s third largest municipality, and it is experiencing large growth. Because of this growth, it is focusing on housing. Infrastructure in and around Aalborg city is well-functioning and accessible regardless of mode of transportation. Aalborg has grown to be a diverse and vibrant city with cultural and leisure activities for all age groups year round. [1]
Located close to the sea (North Sea and Kattegat), the Limfjord, and the second largest forest (Rold Forest) in Denmark, Aalborg is surrounded by plentiful and beautiful nature. Aalborg Waterfront was once a hectic industrial zone, but stands today as a modern, attractive and exciting area along Limfjord. [2]
Aalborg is both the municipality’s largest city, with a population of 110,000, and the capital of the North Denmark Region. Nearly 581,000 people in 11 municipalities live in the North Denmark Region. [2]
| Size of population (year) | 213,558 (2017) [3] |
| Size (km2) | 1,137.40 km2 [3] |
| Population density (year) | 187.76 (2017) [3] |
| Official language(s) | Danish |
| Time zone | CET |
| Community Gross Domestic Product (GDP) (€) | TBC |
| Major economic activities in the city
|
Aalborg is a highly attractive city in which to invest, work, and live. It has nearly 25.000 students at Aalborg University, and world leading institutions in ICT, life sciences, renewable energy, transport, and intelligent logistics, Aalborg offers competitive wage levels, rent, building taxes, district heating, and electricity expenses. [4] The largest companies in Aalborg Municipality are Siemens Wind Power, Bladt Industries, Sanistål, Alfa Laval, Telenor and KMD. Moreover, employment is high within industry, trade and transportation, construction and ICT. The public sector is also a major employer. [2] |
| Unemployment rate | 0,22 (2016) [3] |
| Greenhouse Gas emissions (total in C02e/year) | 4.176.189 ton CO2 (2014) (including Aalborg Portland) [5] |
| City official website | Click here |
Greenhouse Gas emissions by sector
- Energy
- Transport
- Industry (Chemical Processes)
- Land Use and Agriculture
- Waste
- Wastewater
GHG Emissions – City of Aalborg (2014)
| Emission Source | Amount tCO2e | Percentage |
| Energy | 2380427,73 | 57% |
| Transport | 375857,01 | 9% |
| Industry (Chemical Processes) | 960523,47 | 23% |
| Land Use / Agriculture | 417618,9 | 10% |
| Waste | 41761,89 | 1% |
| Wastewater | 0 | 0% |
References
[1] C. o. Aalborg, „Welcome to Aalborg,“ [Online]. Available: http://www.e-pages.dk/aalborgkommune/1376/html5/
[2] C. o. Aalborg, „Welcome to Aalborg.,“ 2018. [Online]. Available: http://www.e-pages.dk/aalborgkommune/1376/html5/
[3] A. Kommune, „Aalborg in figures 2018,“ Aalborg, 2018.
[4] A. kommune, „Doing Business in Aalborg,“ 2019. [Online]. Available: https://www.aalborg.dk/english/doing-business-in-aalborg/why-choose-aalborg
[5] ICLEI, „ICLEI Members,“ [Online]. Available: https://iclei.org/en/members.html
Budapest is the capital of Hungary and makes up 17% of Hungary’s population. City leaders consider making Budapest a liveable and pleasant city their main responsibility. Main points of attractions include the Budapest Zoo, spas, parks and green areas and theaters. (Budapest)
The city is along the Danube, in the middle of the Carpathian basin, and one third of the city is surrounded by low mountains. The geology of the city is very important for the city’s economy; hot springs breaking through the mountains help support a spa culture even today. (Budapest)
| Size of population (year) | 1,749,734 [2] |
| Size (km2) | 525 [1] |
| Population density (year) | 3,351 residents/km2 [3] |
| Official language(s) | Hungarian |
| Time zone | CET |
| Community Gross Domestic Product (GDP) (€) | €41.1bn in 2016 [4] |
| Major economic activities in the city
|
Tourism is one of the biggest sources of revenue for Budapest. (Review) |
| Population growth trend | +0.26% annually since 2015 [3] |
| % of population living in urban areas | 72.1 of total population (2017) [6] |
| Average annual rate of urbanisation | 0.36% annual rate of change (2015-20) [6] |
| Greenhouse Gas emissions (total in C02e/year) | 10,247,355 tCO2e (2005) |
| City official website | Click here |
Greenhouse Gas emissions by sector
- Municipal
- Tertiary
- Transport
- Residential
- Public lighting
- Industry
| Source | Amount tCO2e | % |
|---|---|---|
| Municipal | 484,551.8 | 4.73% |
| Tertiary | 2,606,547.96 | 25.44% |
| Transport | 2,176,546.47 | 21.24% |
| Residential | 3,828,116.31 | 37.36% |
| Public lighting | 54,144.13 | 0.53% |
| Industry | 1,097,449.29 | 10.71% |
References
[1] Budapest. (no date). General information about Budapest. [Online]. Available: http://budapest.hu/sites/english/Lapok/General-informations-about-Budapest.aspx
[2] ICLEI. (no date). ICLEI Members. [Online]. Available: https://iclei.org/en/members.html
[3] Review, W. P. (no date). Budapest Population 2019. [Online]. Available: http://worldpopulationreview.com/world-cities/budapest-population/
[4] European Commission, “Budapest”, [Online]. Available: https://ec.europa.eu/growth/tools-databases/regional-innovation-monitor/base-profile/budapest
[5] The European Job Mobility Portal, “Labour market information Budapest”, [Online]. Available: https://ec.europa.eu/eures/main.jsp?countryId=HU&acro=lmi&showRegion=true&lang=en&mode=text®ionId=HU0&nuts2Code=%20&nuts3Code=null&catId=2772
[6] Index Mundi, “Hungary Demographic Profile 2018”, [Online]. Available: https://www.indexmundi.com/hungary/demographics_profile.html
Cork is the second largest city in the Republic of Ireland and the economic and cultural center of Southern region of the country. Thanks to a historical decision, the city has been enlarged in size on 31 May 2019, welcoming 85,000 new citizens.
Cork is a city located in the province of Munster, is south-westen Ireland. It lays on an island on the river Lee, on the shores of the natural port of Lough Mahon. Located on the Celtic Sea, it experience mild oceanic climate and occasionally suffers from river floods
The city has engaged in a variety of innovation projects and initiatives in the past years. A Cork Smart Gateway Strategy, the Cork Healthy Cities and Cork Learning City initiatives. In addition, the city council joined Urban Leds II to address low emission targets and resilient development for its citizens.
| Size of population (year) | 125,667 (2019) |
| Size (km2) | 37.3 km² |
| Population density (year) | 3.300 inhabitants/km² (2011) |
| Official language(s) | English, Irish |
| Major economic activities in the city | Cork is the second largest city in Ireland and hosts a vibrant and developing economy. The city has been awarded as the most business friendly small city in Europe for the period 2014-2015 (European Regions and Cities Future Reports). Cork has development an environment of large and medium multinational enterprises operating in the IT and Retail sector. Moreover, enterprises operating in the city focus their attention on research and development.
During 2019, the city has underwent a major expansion on their border, expanding their boundaries, making the city 5 times larger and a population increase of more than 85.000 people. |
| Unemployment rate | 5,3% |
| GDP | € 8 378 million (Data obtained by national pcGDP* city population) |
| Greenhouse Gas emissions (total in C02e/year) | 2460935 tCo2e (2011) |
| City official website | Click here |
Greenhouse Gas emissions by sector
- Buildings, equipment/facilities and industry
- Transport
| Source | Amount tCO2e | % |
|---|---|---|
| Buildings, equipment/facilities and industry | 1837580 | 74.67% |
| Transport | 623354 | 25.33 |
Larissa is the city capital of the Thessaly region and the fourth largest municipality in Greece. it accounts for a rich historical background: the main historical personalities from the city are Achilles and Hippocrates. It is located 82 km far from the tallest Hellenic mountain , the Olympus (2,917 m); 64 km from the nearest port of Volos, in the Pegasus Gulf, and 26 from the Central Greece National Airport.
Larissa is located in a strategic position in Greece and serves as the main connection hub between Thessaloniki and Athens. It also account for the main agriculture production center of the country.
Larissa embarked on a process of modernisation and sustainable transformation to foster a more thriving and competitive environment. As part of URBAN LEDS, the city would develop a low emission and climate adaptation development strategy, with the aim to foster administrative cooperation with regional and national authorities.
| Size of population (year) | 162,591 inhabitants |
| Size (km2) | 335.12 km² |
| Population density (year) | 485 inhabitants/km² |
| Official language(s) | Greek |
| Major economic activities in the city | Being home to an ancient theatre and one of the major greek cultural centers, Larissa’s main activity relies on the promotion of its history and tourism. Moreover, agricultural production plays a role in the city economy, as well as logistics and trade, thanks to the connection with the port of Volos. However, the city suffers from high unemployment, couple with the financial crisis, and high-skilled labour migration. Those elements add difficulties for the city to build a resilient high-skilled labour market and industrial clusters in the city. |
| Unemployment rate | 20.7% (2017) |
| Time zone | GMT+2 |
| GDP | €1992 million (2014) |
| Greenhouse Gas emissions (total in C02e/year) | 1495837.2 tCo2e (2017) |
| City official website | Click here |
Greenhouse Gas emissions by sector
- Energy/power
- Transport
- Industrial production
- Agriculture
- Residential and Commercial
- Waste
| Source | Amount tCO2e | % |
|---|---|---|
| Energy and power | 718002 | 48% |
| Transport | 269251 | 18% |
| Industrial production | 179500 | 12% |
| Agriculture | 149584 | 10% |
| Residential and commercial | 119667 | 8% |
| Waste | 89833 | 4% |
News from the European Region
Peer-to-peer learning among Urban-LEDS cities continues
A summary of two webinars on peer-to-peer exchange on building local climate action funds and driving the local energy transition. Moving climate action forward during the […]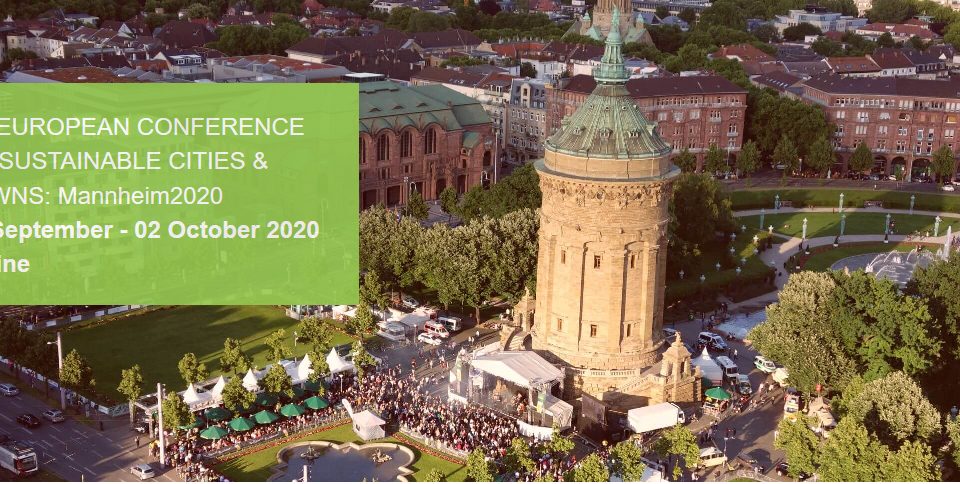
Urban-LEDS inspired Solution Session “Beyond Climate Emergency: Turning ambition to action” at the Mannheim2020 Conference
On Friday 2 October 2020 from 9:30 to 11:00 Urban-LEDS will be part of a solution session at the 9th edition of ICLEI’s flagship European Conference […]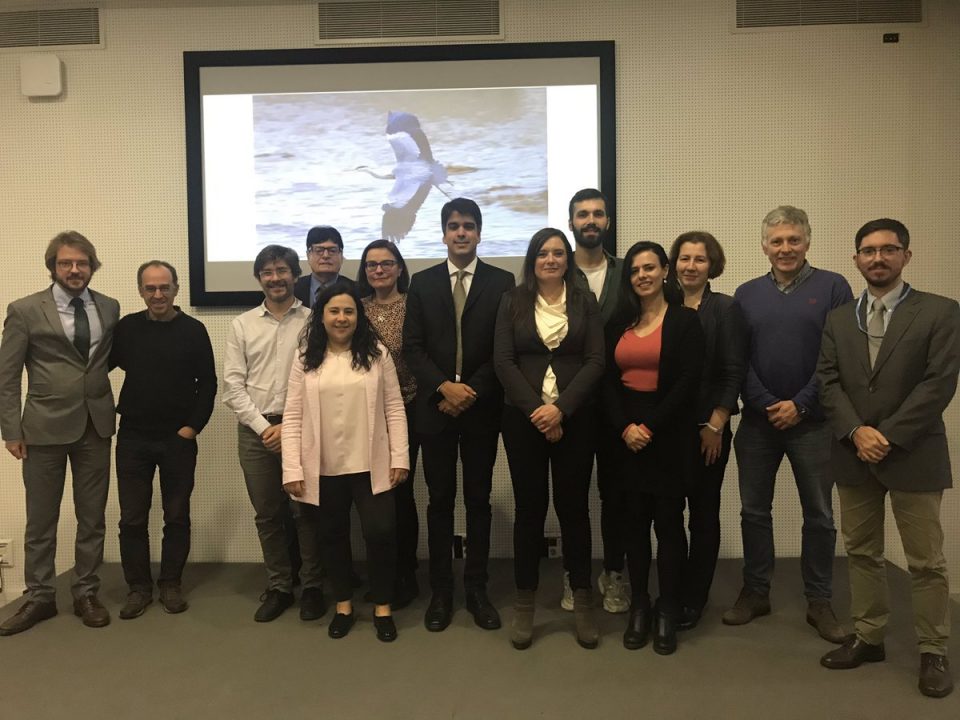
Urban-LEDS cities explore nature-based solutions at COP 25 in Madrid to foster low-emission development
On 12 December Urban-LEDS II cities teamed up with partner cities from the Connecting Nature and CLEVER City projects in Madrid for a joint working session […]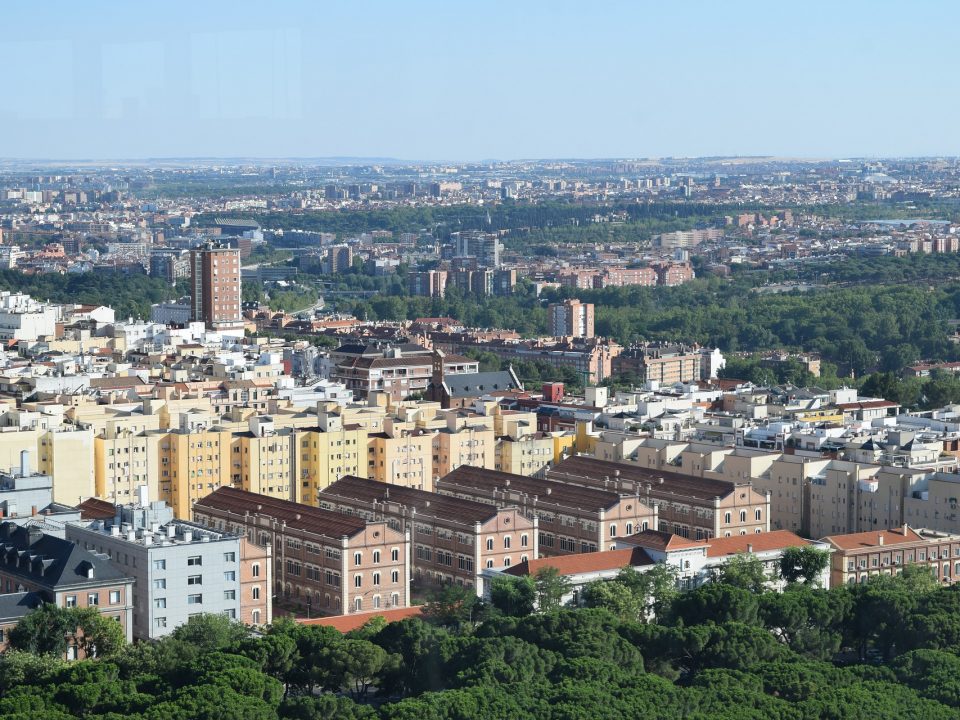
Urban-LEDS cities will come together in Madrid to scale up local implementation of the Paris Agreement at the COP25
On 12 December Urban-LEDS II, together with partnering projects Connecting Nature and CLEVER City projects are coming together in Madrid for a joint working session alongside […]